During a production rollout, the primary challenge is achieving immediate, high-fidelity insight into the new version's behavior. The critical window just after deployment demands a tool that can effectively cut through the noise of the entire system to isolate the signal from the canary instances. Relying on dashboard-level metrics often introduces a lag, while manually tailing and filtering logs across multiple hosts can be cumbersome and error-prone.
A proactive, terminal-based workflow can drastically reduce Mean Time to Detection (MTTD) for deployment-related issues. The LogLens Pro `watch` command is designed for this exact scenario, transforming your terminal into a live, structurally-aware command center for real-time operational intelligence.
The Scenario: A Canary Rollout of `auth-service`
We are deploying version `v2.1.0` of our `auth-service` via a canary release, directing 5% of production traffic to the new instances. The objective is to monitor this traffic segment for any anomalous behavior—specifically error rates and latency—before proceeding with a full rollout. The service emits structured JSON logs.
The logs are structured JSON and look like this:
head -5 auth.log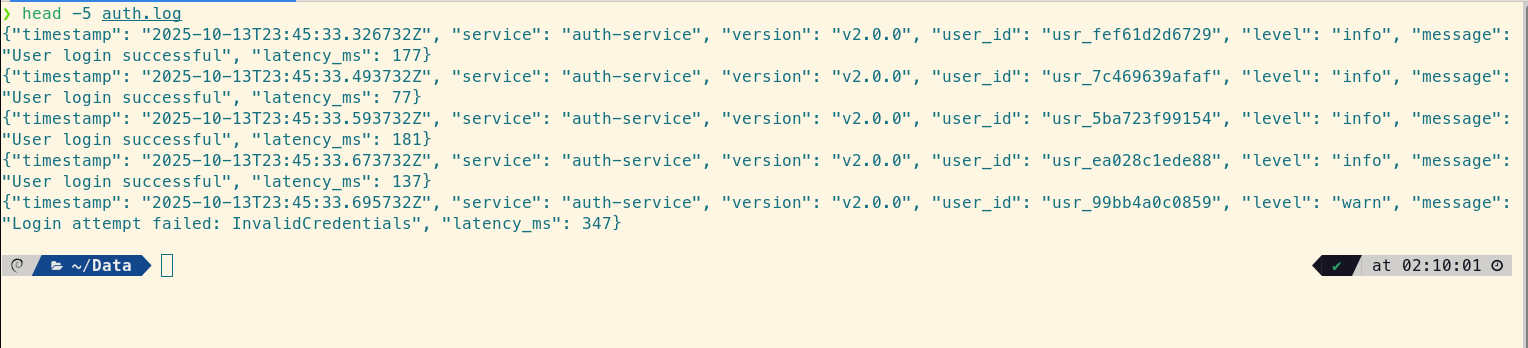
First, let's quickly discover the available fields using the `fields` command:
loglens fields --details auth.log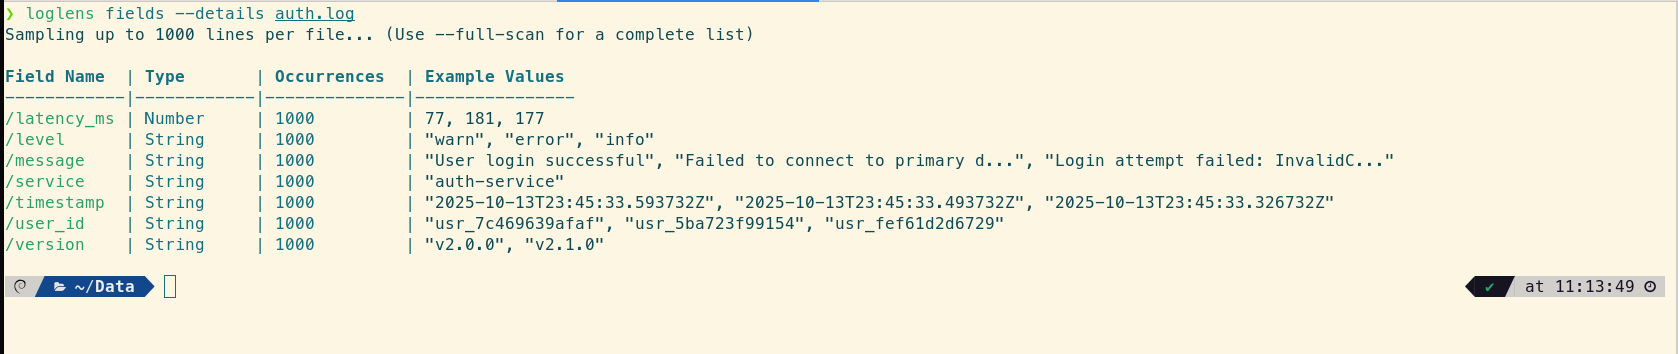
The Standard Toolkit: Powerful, but with Operational Friction
An experienced engineer's toolkit for this task is robust, typically involving a chain of `tail`, `grep`, and often `jq` for handling JSON. A common approach might look like this:
tail -f /var/log/auth.log | grep '"version":"v2.1.0"' | jq 'select(.level == "error" or .level == "critical")'This is a capable command chain, but it presents several points of friction in a high-stakes, real-time context:
- Cognitive Overhead: This requires context-switching between the syntaxes and capabilities of three separate tools. Modifying the filter on the fly becomes a non-trivial edit.
- Reliance on String Matching: The initial `grep` is still performing a substring search. It's vulnerable to changes in formatting (e.g., whitespace) and offers no insight into the actual data structure.
- Uni-dimensional Analysis: The pipeline is a funnel. You can filter for errors, but you cannot then highlight a different field of interest (e.g., a specific `failure_reason`) within those filtered results. This multi-dimensional view is crucial for rapid diagnosis.
A Better Way: The `loglens watch` Workflow
With `loglens watch`, we can construct a more resilient and insightful monitoring view using a single, cohesive command for real-time log analysis.
Step 1: Isolate the Canary Traffic with `--where`
First, we apply a structurally-aware filter to the live log stream, isolating only the logs from our new `v2.1.0` canary. The `--where` flag uses the same robust query engine as `loglens query`, operating directly on the parsed log structure, not the raw text.
# Watch the log file, filtering the live stream for version v2.1.0
loglens watch ./auth.log --where 'version == "v2.1.0"'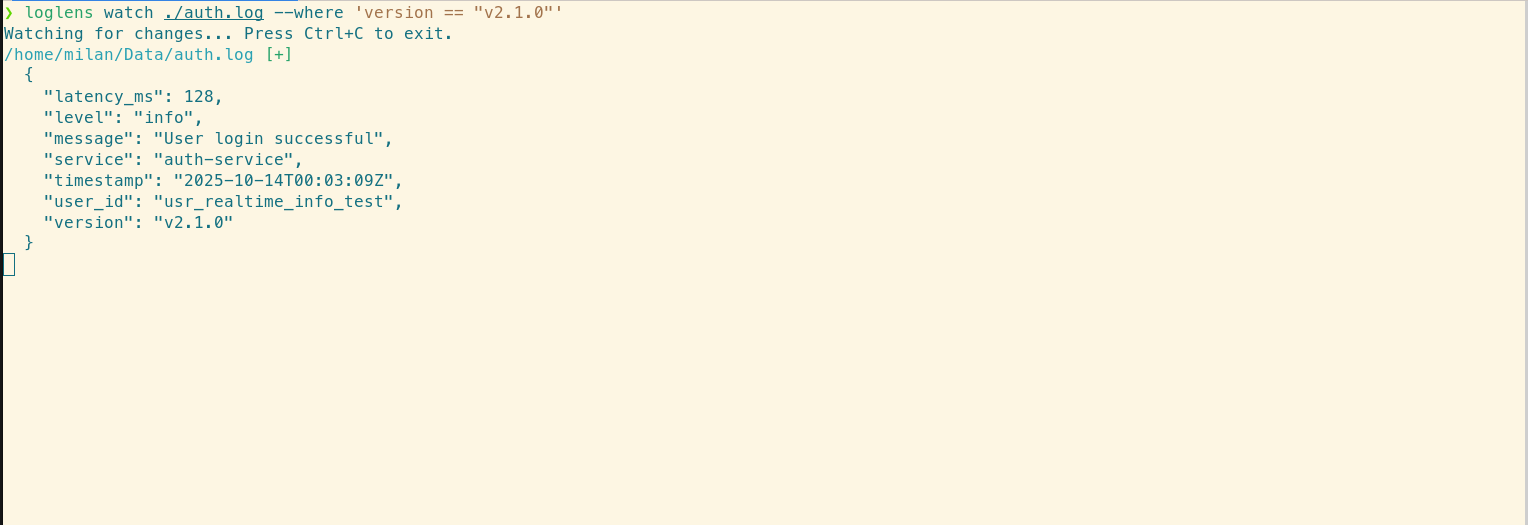
This immediately provides a clean, dedicated feed for our canary release, eliminating the noise from the stable production instances.
Step 2: Create a "Red Alert" View for Errors
To create a definitive "red alert" view, we combine a filter with a highlight. The command will now only surface log entries that are both from the new version and have a log level of "error," while simultaneously drawing attention to a specific failure reason we're concerned about. This is a crucial capability that standard toolchains lack.
# Filter for errors from the new version AND highlight "DBTimeout" occurrences
loglens watch ./auth.log --where 'version == "v2.1.0" AND level == "error"' --highlight "DBTimeout"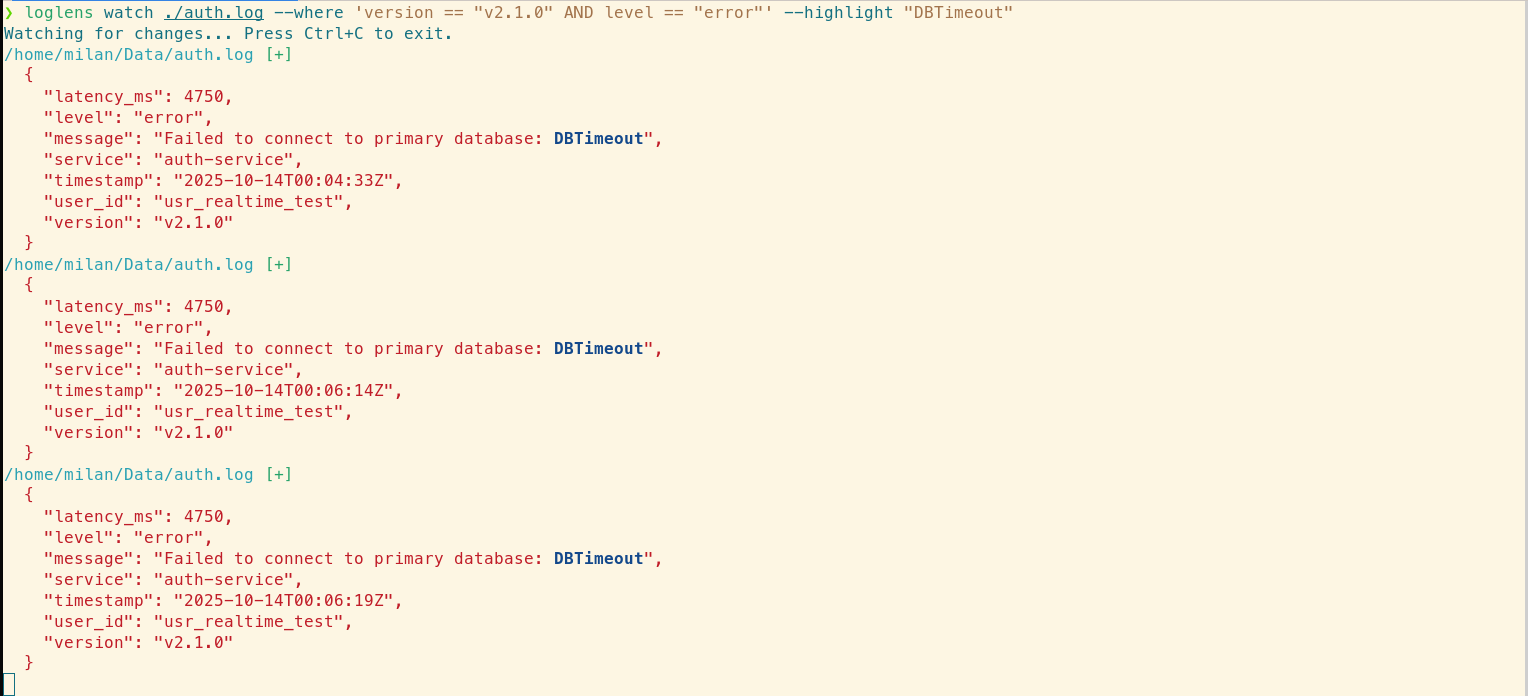
This command delivers an unambiguous, real-time signal. It can run for the duration of the deployment; a silent screen indicates a healthy rollout. In this example, an error appears, and the `--highlight` flag immediately draws our eye to the `DBTimeout` message. We have actionable data to halt the deployment and investigate, preventing a localized issue from escalating into a site-wide outage.
Bonus: Beyond Errors, Monitoring for High Latency
Error rates are not the only indicator of a problem. A slow service is a broken service. We can easily adapt our command to watch for high-latency requests from the canary, giving us a complete performance picture.
# Watch for any requests from the canary taking longer than 500ms
loglens watch ./auth.log --where 'version == "v2.1.0" AND latency_ms > 500'
This allows you to monitor performance regressions with the same ease as error monitoring, providing a comprehensive view of your canary's health directly in your terminal.
Deploy with Data, Not Hope
The `loglens watch` workflow elevates deployment monitoring from a reactive, tool-juggling exercise to a controlled, data-driven process. It provides engineers with the ability to:
- Reduce Risk: Isolate and analyze behavior in canary or blue-green deployments before it impacts the entire user base.
- Accelerate Rollbacks: Obtain immediate, undeniable evidence of a regression, enabling faster and more confident rollback decisions.
- Increase Deployment Velocity: Build confidence in the deployment process by observing its stability directly and in real time.
Stop waiting for lagging alerts from upstream monitoring systems. With `loglens watch`, you can observe the impact of your changes the instant they happen and ship with confidence.
Frequently Asked Questions
How is this better than `tail -f | grep`?
While `tail | grep` is great for simple text searches, `loglens watch` understands the structure of your logs. This allows you to build much more precise and reliable queries (e.g., `status_code >= 500` instead of just grepping for "500"), and combine filtering with highlighting for multi-dimensional analysis, all in a single command.
What if my logs are not in JSON format?
LogLens automatically detects both JSON and logfmt-style logs. The query engine works seamlessly with both, allowing you to use the same powerful `--where` filters regardless of the structured format.
What if my logs are in a completely different format like CSV or Excel?
For the most powerful analysis, `loglens` works best with structured line-based formats like JSON or logfmt. If your data is in another format like CSV, Excel, or Parquet, you can use our companion tool, Datamorph, to quickly convert it. For example, you could run `datamorph convert my_logs.csv my_logs.jsonl` to prepare your data for `loglens`.