Your server CPU is spiking, but your analytics dashboard shows normal user traffic. This discrepancy usually points to one culprit: Bot traffic. Whether it's aggressive scrapers, vulnerability scanners, or a coordinated attack, these requests don't show up in Google Analytics, but they definitely show up in your Nginx access logs.
Standard security tools are great, but sometimes you need to investigate raw access logs immediately to block an active threat. The problem is that raw access logs are dense and difficult to read manually.
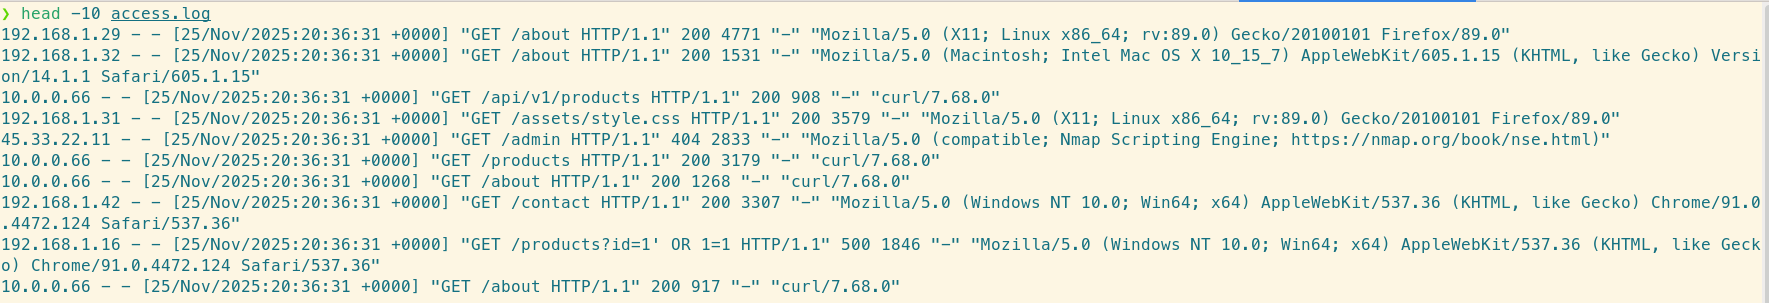
The raw log file: hard to parse with the naked eye.
Here is how to use the LogLens CLI to identify and isolate malicious actors in your Nginx logs.
Prerequisite: Discover Your Log Fields
Before you start filtering by http_user_agent or status, it helps to know exactly what fields LogLens has parsed from your Nginx logs. LogLens automatically detects standard Nginx formats, but different configurations might expose different data.
Use the fields command to see a list of all available keys, their data types, and example values from your specific log file:
# List discoverable fields and example values
loglens fields access.log --details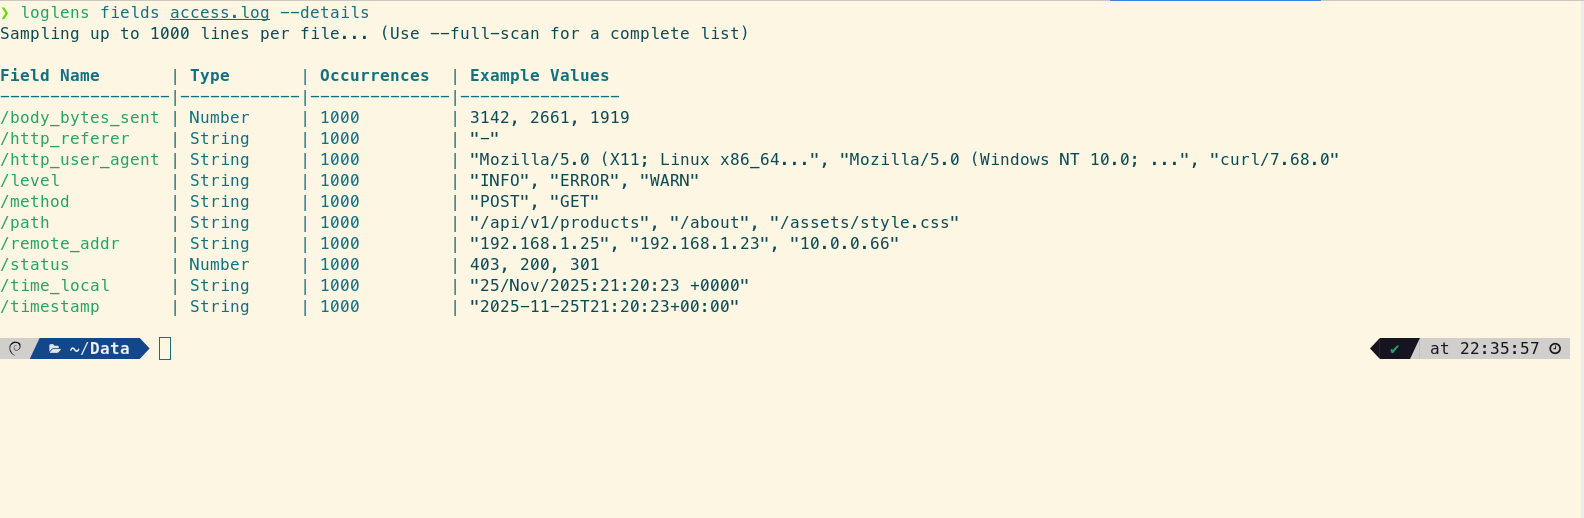
Instantly see available fields like `http_user_agent` and `remote_addr`.
1. Identify Top User Agents
The quickest way to spot a scraper is to look at the http_user_agent field. Legitimate browsers have complex user agent strings. Bots often have very short ones (like "Python-urllib" or "Go-http-client") or identical strings repeated thousands of times.
Use the stats group-by command to generate a distribution of User Agents. We also include the average body_bytes_sent because bots often receive identical response sizes.
# Find frequent User Agents in the last hour
loglens stats group-by access.log \
  --by "http_user_agent" \
  --avg "body_bytes_sent" \
  --where 'timestamp > "1h ago"'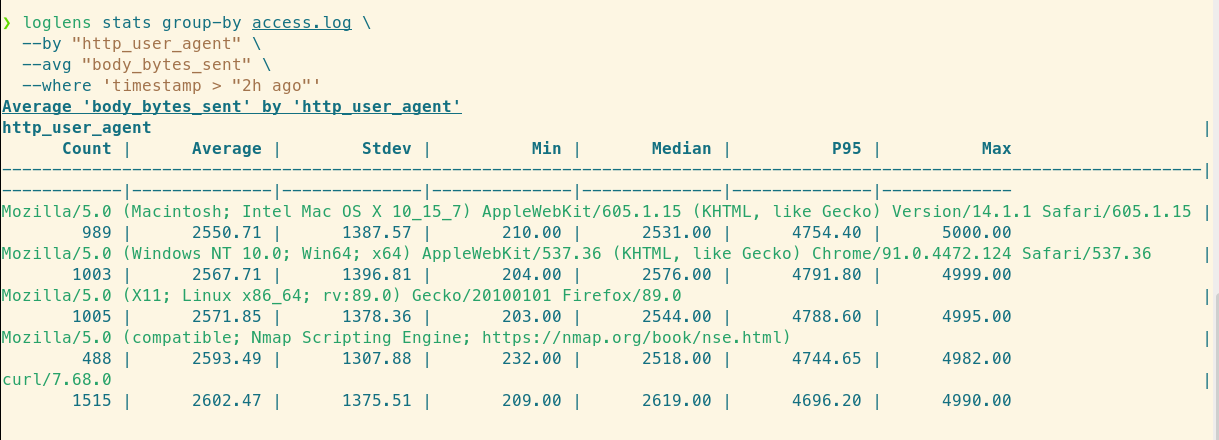
The curl/7.68.0 agent is spiking with 1,515 requests, indicating a bot.
What to look for: If you see a generic script name accounting for 40% of your traffic, you have found your bot.
2. Find the Source of 403/404 Errors
Vulnerability scanners (like bots looking for wp-login.php or .env files) generate a high volume of 404 (Not Found) and 403 (Forbidden) errors. You can isolate these requests to find the attacking IP addresses.
We can filter for client errors and then group by IP address, again checking response size to confirm patterns:
# Identify IPs generating the most client errors
loglens stats group-by access.log \
  --where 'status >= 400 && status < 500' \
  --by "remote_addr" \
  --avg "body_bytes_sent"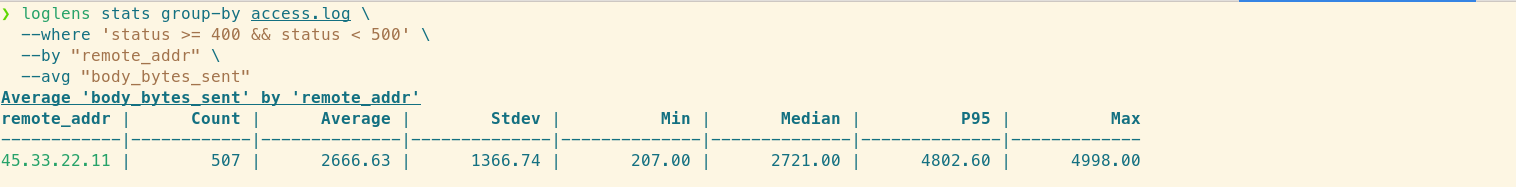
Identifying a single IP responsible for the majority of 404 errors.
3. Detect SQL Injection Attempts
Sophisticated attackers will try to inject SQL commands into your URL parameters. These patterns are distinct and can be found using LogLens string matching.
To search for common SQL injection patterns (like UNION SELECT or OR 1=1) in the requested path:
# Search for potential SQL injection patterns
loglens query access.log \
  'text contains "UNION" || text contains "SELECT" || text contains "sleep("' \
  --since "24h ago"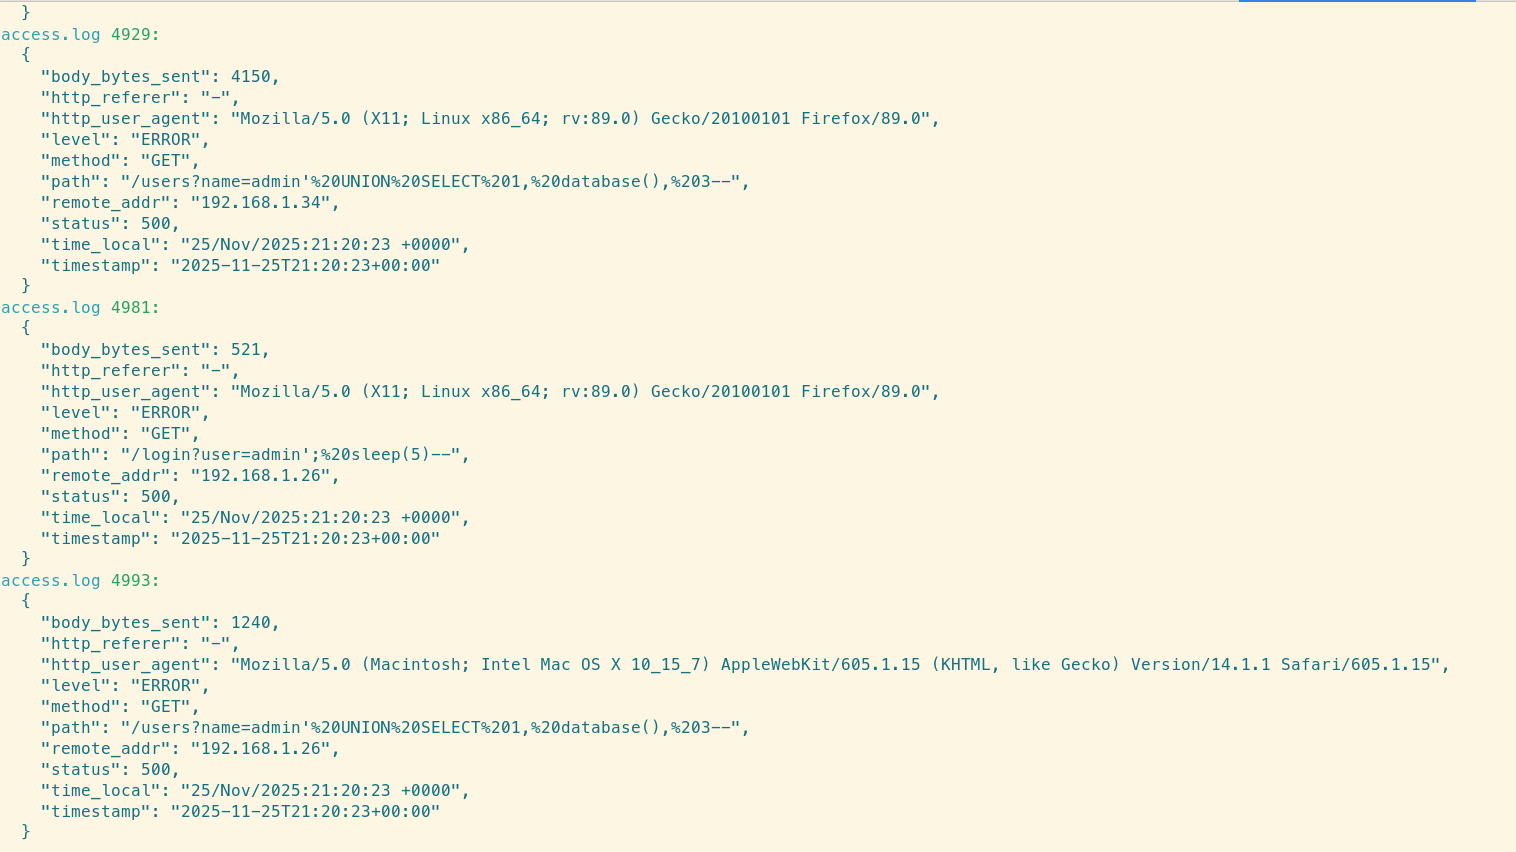
LogLens successfully isolating the malicious requests.
If this query returns results, inspect the remote_addr immediately. You may need to block that IP at the firewall level.
Summary: Proactive Log Defense
Nginx logs are your first line of defense during an incident. By using LogLens, you can turn a massive text file into actionable intelligence in seconds:
- Group by User Agent to spot scrapers.
- Filter by Status 4xx to find vulnerability scanners.
- Query for patterns to detect code injection attempts.