Your API is the heart of your application, but what happens when it develops a performance issue? A slow endpoint can lead to frustrated users, cascading failures, and a frantic search for the root cause. Digging through raw logs with `grep` to find performance bottlenecks is slow, tedious, and often inconclusive.
To move from guessing to knowing, you need to aggregate data to see the bigger picture. That’s precisely what the LogLens Pro `stats` command is for. It transforms your logs from a stream of text into a source of actionable performance insights. Let's walk through a full diagnostic workflow.
Step 1: Get a High-Level Overview with `stats summary`
We'll start with a vague report: "The API feels sluggish." We don't know where the problem is, so we need a high-level overview. This is the perfect job for stats summary, which automatically discovers the structure of your logs and generates a summary of the entire dataset.
# Get an automatic summary of all fields in the log files
loglens stats summary ./api-logs/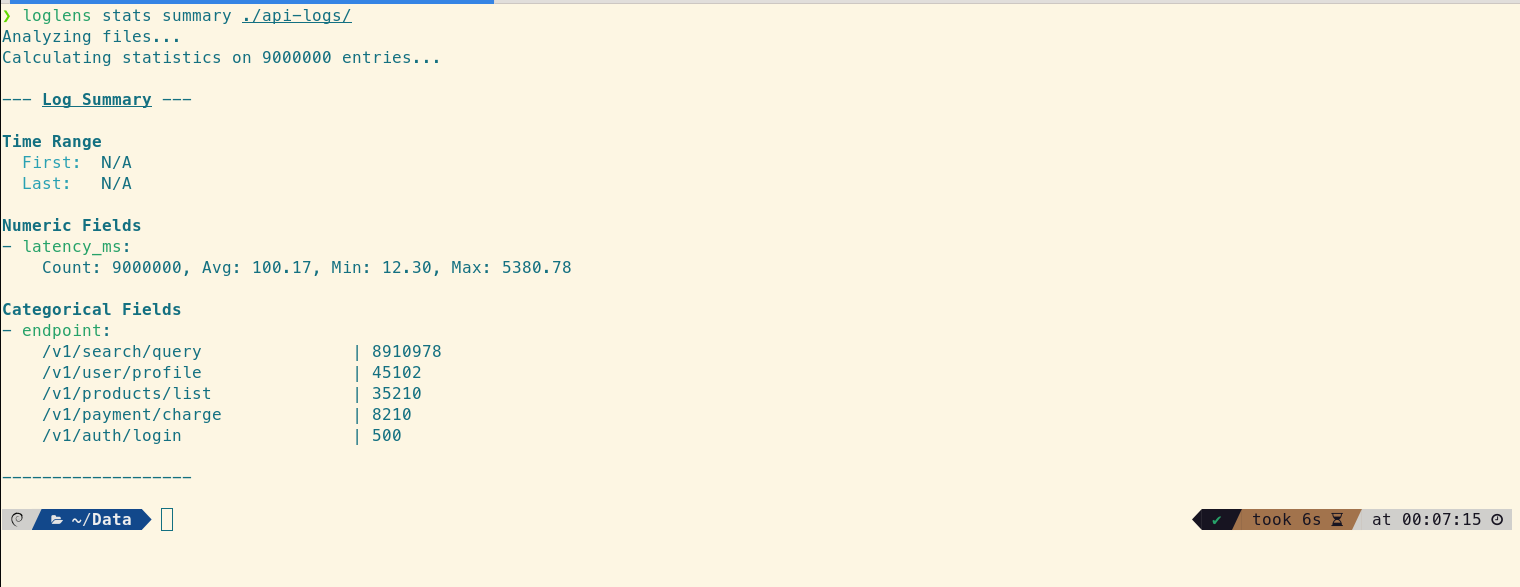
The overall average latency is just 100.17ms, which seems fast. However, the `endpoint` breakdown reveals that traffic is heavily skewed towards `/v1/search/query`. This raises a question: is the low overall average hiding a performance problem in a less frequent but more critical endpoint like `/v1/payment/charge`?
Step 2: Find Slow API Endpoints with `stats group-by`
To test this hypothesis, we need to see the latency statistics for each endpoint individually. The stats group-by command is purpose-built for this. It calculates aggregate statistics for a numeric field, grouped by a categorical field.
# Calculate latency stats for each endpoint
loglens stats group-by ./api-logs/ --by endpoint --avg latency_ms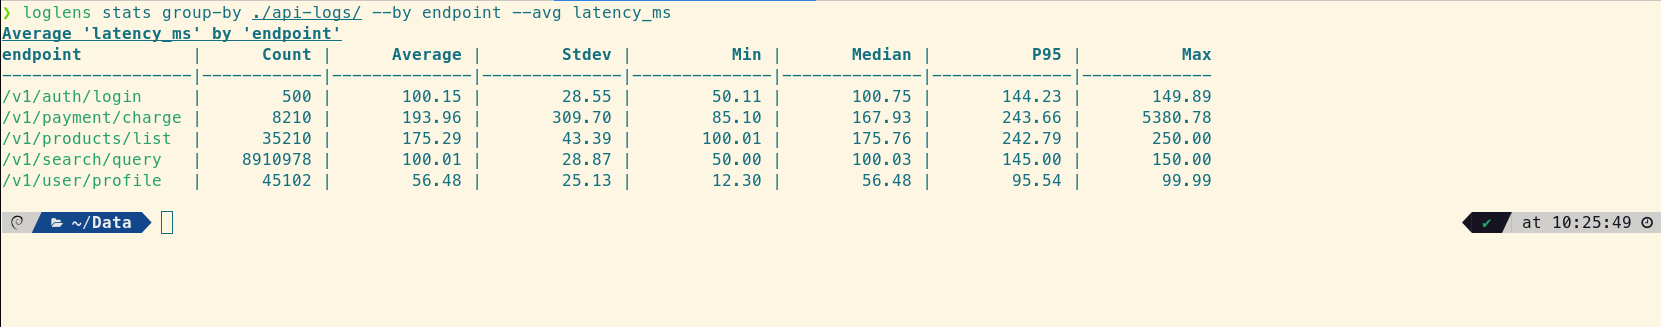
This single command provides the crucial "aha!" moment. The /v1/payment/charge endpoint's average latency is 193.96ms, but the real insight comes from the percentiles. The Median (P50) is 167.93ms, while the P95 is 243.66ms, and the Max value is a staggering 5380.78ms. The huge gap between the median and the max value is a classic sign of a "long-tail latency" problem, where a small number of very slow requests are degrading the user experience.
Step 3: Quantify the Performance Bottleneck with `count`
We know the payment endpoint has some extremely slow requests, but how many? Is it one or two outliers, or a significant pattern? The loglens count command gives us a precise answer by counting lines that match a specific query.
# Count how many payment requests took longer than 1 second (1000ms)
loglens count ./api-logs/ 'endpoint == "/v1/payment/charge" AND latency_ms > 1000'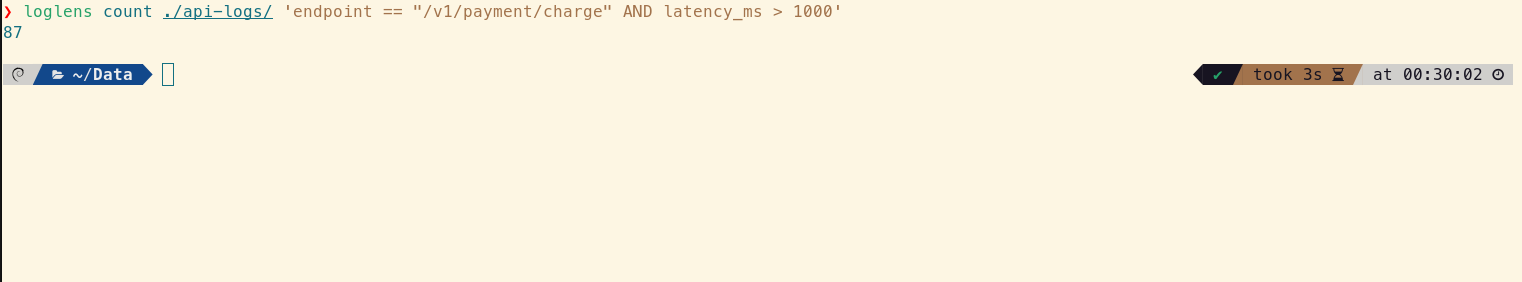
The result is 87. It's not just one or two outliers; there's a recurring issue causing a significant number of requests to take over a second. Now we have a well-defined problem to investigate.
Step 4: Find the Root Cause with a Filtered `group-by`
You know what is slow (`/v1/payment/charge`) and how many requests are impacted (87), but you still need to find the root cause—the why. Is this slowdown related to a specific payment provider? We can use stats group-by again, this time filtering *only* for the slow requests to see if there's a correlation.
# For slow payment requests, find the average latency grouped by provider
loglens stats group-by ./api-logs/ --by payment_provider --avg latency_ms --where 'endpoint == "/v1/payment/charge" AND latency_ms > 1000'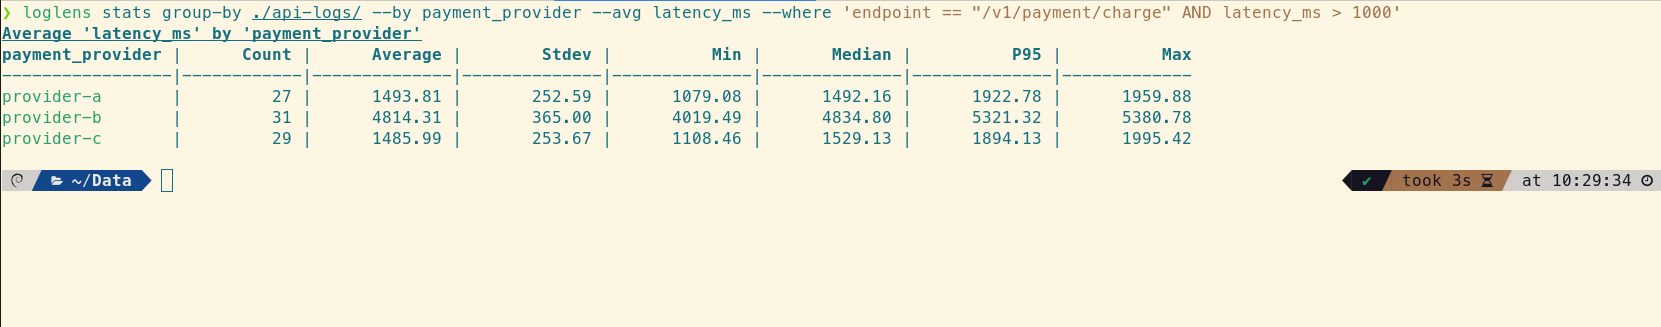
This command delivers the smoking gun. While `provider-a` and `provider-c` are slow (averaging ~1.5s), `provider-b` is in another league entirely. Its average latency is over 4.8 seconds, and its Median latency is also ~4.8s. This proves the issue is systemic: the typical slow request for `provider-b` is extremely slow. The root cause is now crystal clear.
From Vague Report to Actionable Insight
In just four commands, we've transformed a vague "sluggishness" report into a precise, evidence-backed problem statement. We now know that:
- The performance issue is isolated to the
/v1/payment/chargeendpoint. - The problem is a long-tail latency issue, proven by the large gap between the Median (167ms) and Max (5380ms) latencies.
- The scope is significant: 87 requests took over a second to complete.
- The root cause is strongly correlated with
provider-b, which has an average latency over 3x higher than other providers for these outlier requests.
This level of clarity immediately defines our next steps: investigate our integration with `provider-b`, check their status page, and contact their support with concrete data.
Frequently Asked Questions
What is long-tail latency?
Long-tail latency refers to the small percentage of requests that take significantly longer than the average. While they may be infrequent, they can have a major impact on user perception of performance and can indicate underlying systemic issues. Analyzing percentiles (P95, P99) is the best way to detect them.
Why are percentiles more useful than averages for API performance?
Averages can be misleading because they are easily skewed by a few extreme outliers. The median (P50) tells you the typical user experience, while the P95 and P99 tell you the experience for the slowest 5% and 1% of your users. A large gap between the median and P95 is a strong signal of a long-tail latency problem.
Can `loglens stats` analyze logs from multiple servers at once?
Yes. By pointing LogLens to a directory (`./api-logs/` in our example), it will automatically process all log files within that directory in parallel, giving you a unified statistical view across your entire cluster or service.
Upgrade to LogLens Pro for `stats` Read the Stats Command Docs