The "502 Bad Gateway" error is one of the most frustrating issues to debug in a production environment. It indicates that Nginx, acting as a reverse proxy, received an invalid response from an upstream server (like your Python, Go, or Node.js application). Similarly, a "504 Gateway Time-out" means the upstream server didn't respond at all within the allotted time.
When traffic is high, /var/log/nginx/access.log becomes a blur of text. Using standard Unix tools like head or cat often results in an unreadable wall of data, making it nearly impossible to spot patterns.
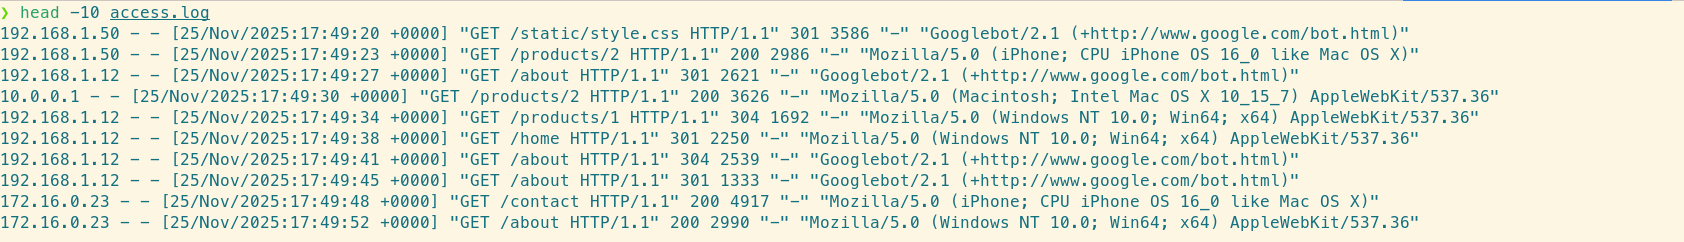
The raw access log: hard to read, harder to query.
Using grep or awk to find specific patterns is brittle because the logs are unstructured text by default. LogLens solves this by including a native, zero-configuration Nginx parser that turns raw log lines into queryable structured data automatically.
Here is a workflow to isolate and resolve 502/504 errors using the LogLens CLI.
Step 1: Quantify the Impact
Before diving into individual lines, you need to know how bad the outage is. Is every request failing, or just 1%? Use the count command to filter specifically for status codes greater than or equal to 500.
# Count 5xx errors in the last hour
loglens count /var/log/nginx/access.log 'status >= 500' --since "1h ago"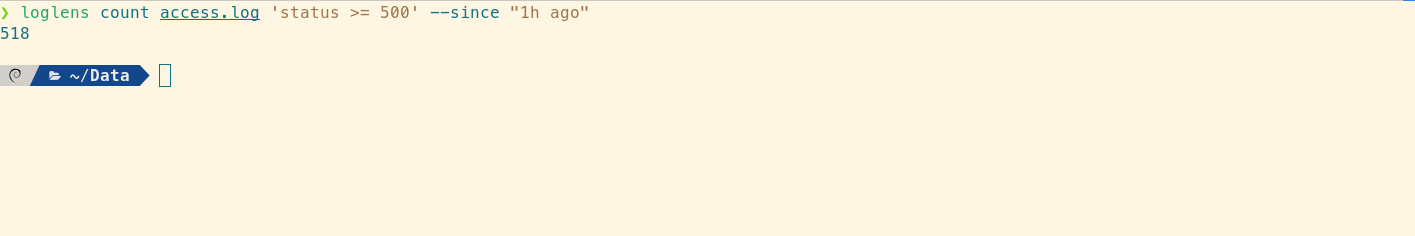
Instantly assessing the magnitude of the incident.
Because LogLens parses the Nginx format automatically, it correctly identifies the status code as a number, allowing for mathematical comparisons (>=) rather than just string matching.
Step 2: Isolate the Failing Endpoint
A common cause of 502 errors is a single crashing endpoint or a slow database query affecting a specific route. Use the stats summary command with a filter to see exactly which paths are returning errors.
# Summarize fields ONLY for requests that resulted in a 500+ error
loglens stats summary /var/log/nginx/access.log --where 'status >= 500'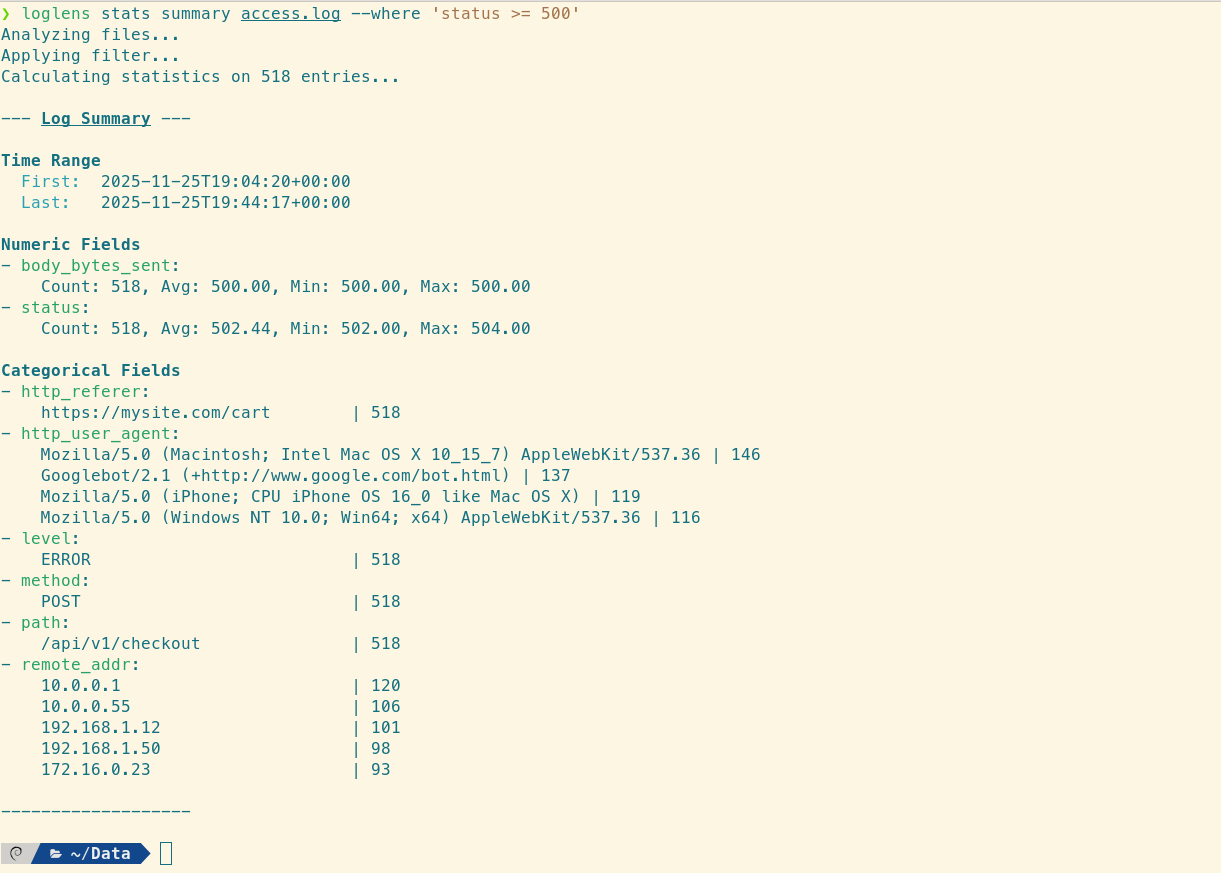
Pinpointing the failing endpoint in seconds.
The output will display a "Categorical Fields" section. Look at the path (or request_line) field. If you see that 99% of the errors are coming from POST /api/v1/checkout, you have successfully isolated the problem to the Checkout Service.
Step 3: Deep Dive with Structured Querying
Now that you know the timeframe and the endpoint, you need to see the context. Who is making these requests? Are they coming from a specific user agent (bot)?
Use the query command to view the full structured details of the problematic logs:
loglens query /var/log/nginx/access.log \
  'status == 502 && path == "/api/v1/checkout"' \
  --since "15m ago"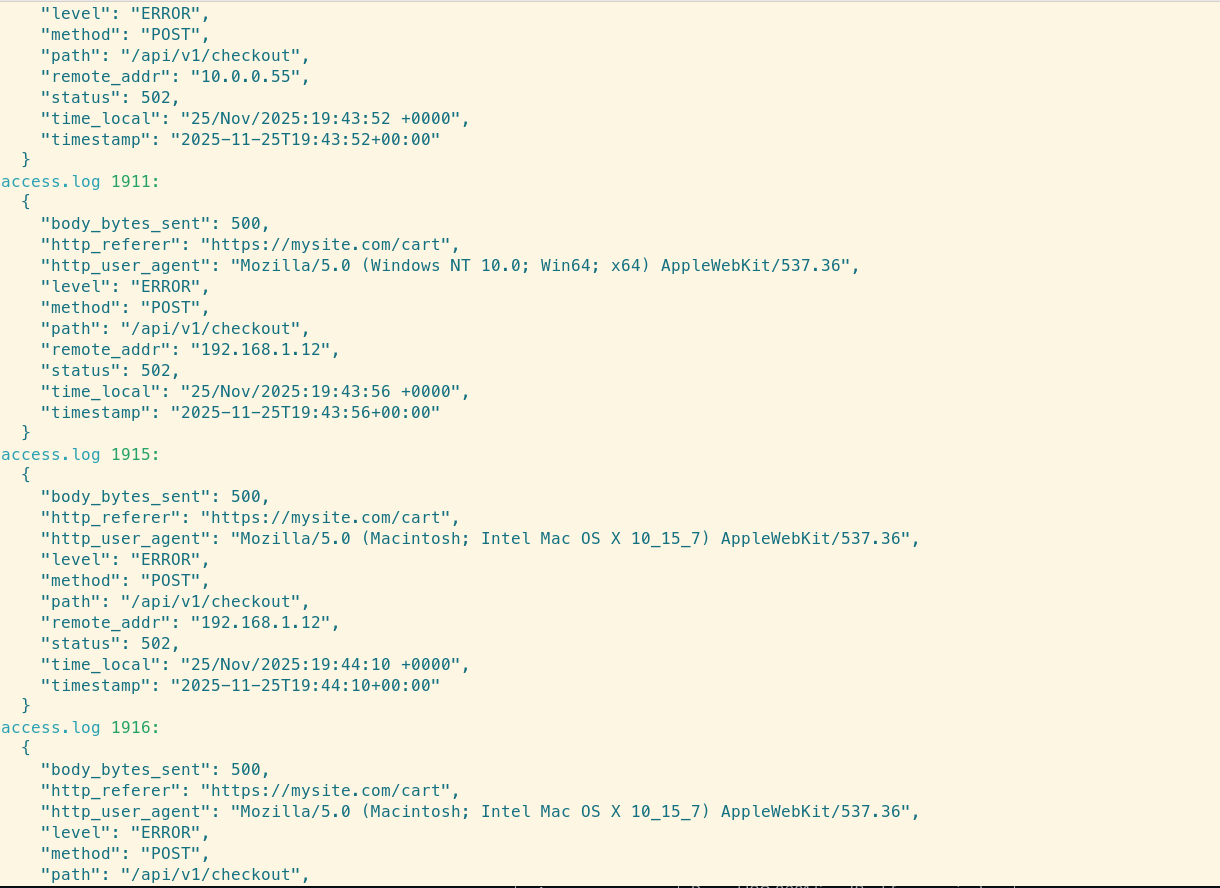
Structured view revealing the context of the errors.
LogLens transforms the messy raw log lines into readable, structured JSON objects, making it easy to verify specific fields. Because the Nginx parser extracts the http_referer and http_user_agent, you can easily verify if this is a DDoS attack or a legitimate traffic spike.
Reference: Nginx Field Mapping
LogLens automatically maps standard Nginx Common Log Format (CLF) parts to specific field names. Use these names in your queries and stats commands:
| LogLens Field | Nginx Log Component | Example Value |
|---|---|---|
timestamp |
Parsed ISO 8601 time | 2025-11-26T15:00:00+00:00 |
status |
HTTP Status Code (Numeric) | 502, 200 |
method |
HTTP Method | GET, POST |
path |
Request URI path | /api/v1/checkout |
body_bytes_sent |
Response size in bytes | 1024 |
Step 4: Real-Time Monitoring (Tailing)
After deploying a hotfix to your upstream application, you need to verify that the 502s have stopped. Instead of flooding your terminal with tail -f, use loglens watch with a filter. This will only print new lines that match the error criteria.
# Watch for new 502 errors in real-time
loglens watch /var/log/nginx/access.log --where 'status == 502'
If the screen stays blank, your fix worked.
Summary
Nginx logs are information-dense but difficult to parse with standard Unix tools. LogLens recognizes the format automatically, allowing you to:
- Filter by status code numerically (status >= 500).
- Group errors by path to isolate failing services.
- Watch for specific error codes in real-time.
Stop grepping for " 502 " and start analyzing your ingress traffic effectively.