As technical leads and managers, you're constantly evaluating tools. It's not just about features; it's about the Return on Investment (ROI). How does a tool impact your team's velocity, your budget, and your system's stability? Sticking with slow, basic tools like `grep` or overpaying for complex SaaS log management platforms has hidden costs that directly impact your bottom line.
LogLens isn't just another log querying tool; it's a strategic investment designed to deliver quantifiable ROI. This post breaks down how LogLens Pro pays for itself by tackling the major pain points of traditional log management and investigation.
The Hidden Costs Bleeding Your Budget & Time in Log Analysis
Before calculating ROI, let's acknowledge the drains LogLens plugs:
- Wasted Developer Hours: Time spent wrestling `grep`, `jq`, or slow UIs during log investigation is expensive, high-stress time lost.
- Exorbitant SaaS Logging Bills: Ingestion, retention, indexing, and rehydration fees quickly add up, often costing thousands monthly for comprehensive log management services.
- Slow Incident Response (High MTTR): Every minute struggling with application logs during an outage means lost revenue and user frustration.
- Opportunity Cost: Engineers bogged down in debugging aren't creating value or shipping features.
How LogLens Pro Delivers Measurable ROI for Log Investigation
LogLens Pro tackles these costs head-on:
1. Slash Cloud Logging Costs by up to 99%
One of the most dramatic gains comes from changing how you store logs. Instead of paying premium SaaS rates for ingestion, indexing, and searchable retention, you can archive logs to ultra-cheap object storage (like S3, GCS, Azure Blob).
LogLens Pro makes this feasible as a powerful CLI tool that seamlessly analyzes compressed log archives (`.gz`) directly from your local machine after download, eliminating costly SaaS fees and "rehydration" charges.
# Example: Download archive and perform instant log analysis
aws s3 cp s3://my-log-archive/prod-api-`date +%Y-%m-%d`.log.gz .
loglens tui prod-api-`date +%Y-%m-%d`.log.gz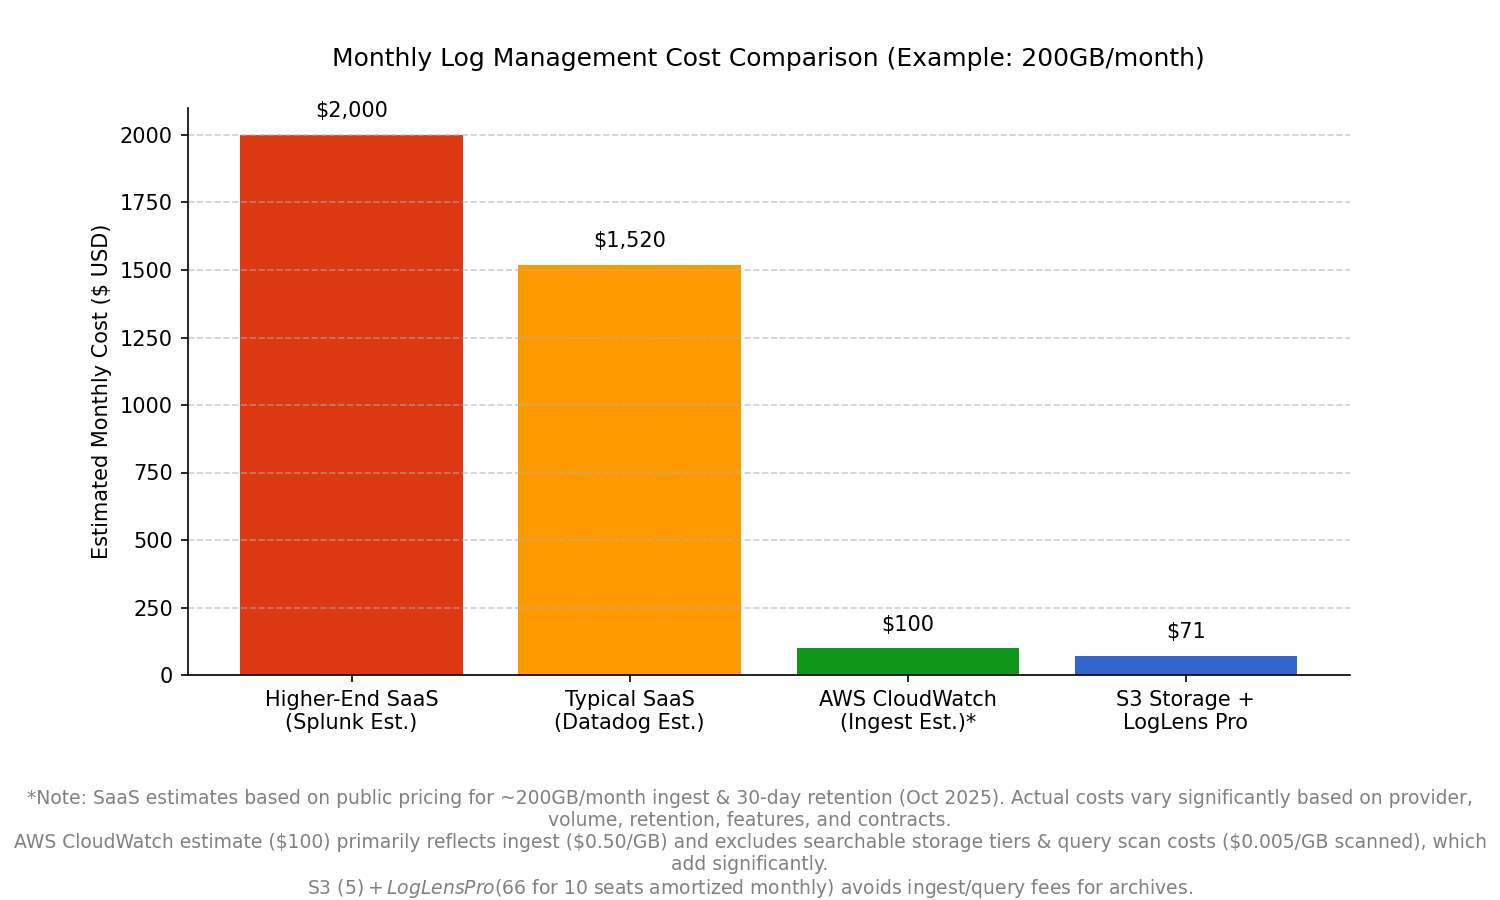
*Note: SaaS estimates based on public pricing for ~200GB/month ingest & 30-day retention. S3 + LogLens Pro avoids ingest/query fees for archives.*
Benefit: Directly cuts monthly cloud bills by replacing expensive ingest/indexing/retention fees with low-cost object storage. (➡️ Read our detailed guide: Reduce Logging Costs by 99%: The S3 Cold Storage + LogLens Workflow).
2. Drastically Reduce Mean Time To Resolution (MTTR)
During incidents, faster debugging is critical. LogLens Pro accelerates root cause analysis for both structured and unstructured logs:
- Blazing Fast Queries: Filter structured logs (JSON, logfmt) orders of magnitude faster than `grep` + `jq`.
- Instant Statistical Insights: Use `stats summary`, `group-by`, and `describe` to instantly spot anomalies without manual log parsing.
- Real-Time Monitoring: Use `watch` to tail multiple server logs, apply filters, and highlight terms live.
# Example: Quickly find P95 latency for a specific endpoint using structured log querying
loglens stats describe ./api-logs/ latency_ms --where 'endpoint=="/v1/cart/checkout"'
Benefit: Quicker incident response reduces downtime and improves system stability.
3. Boost Developer Productivity
Give valuable time back to your engineers and improve their workflow:
- Intuitive TUI: Interactively explore application logs, filter dynamically, and drill down without complex commands using `loglens tui`.
- Structured Data Power: Query fields directly (`user.id == "abc"`), not fragile text patterns.
- Less Context Switching: Stay in the terminal, your primary environment.
Benefit: Reduced debugging friction means more time building features. Improves the developer workflow for log investigation.
4. Streamline DevOps Workflows & Automation
LogLens integrates seamlessly into your automation and DevOps practices:
- Scriptable Analysis: Use `query --json` or `count` in CI/CD pipelines or monitoring scripts.
- Consistent Environment: Works identically locally, on servers via SSH, or with downloaded archives.
# Example: CI check for critical errors post-deploy using log analysis automation
ERROR_COUNT=$(loglens count ./logs/ 'level=="critical"' --since 5m)
if [ "$ERROR_COUNT" -gt 5 ]; then echo "ALERT!"; exit 1; fi
Benefit: Enables robust automation and promotes consistent log investigation practices across environments.
Quantifying the Gains: A Sample ROI Calculation
Let's make this concrete and estimate the business value. Assume:
- Team Size: 10 Engineers
- Average Engineer Cost (fully loaded): $150/hour
- Incidents per month needing log analysis: 5
- Time saved per incident with LogLens Pro: 30 minutes
- Estimated Current SaaS Logging Cost: ~$1500/month
- S3 + LogLens Pro Cost (10 seats): ~$71/month
Monthly Savings (Year 1):
- Time Savings: 10 engineers * 5 incidents * 0.5 hours * $150/hour = $3,750
- Direct Cost Savings: ~$1,500 (SaaS) - $71 (S3+LogLens) = ~$1,429
Total Estimated Monthly ROI: ~$5,179
Conclusion: An Investment in Efficiency
Investing in efficient tooling like LogLens Pro is a sound financial decision. By drastically cutting SaaS logging expenses through archival, slashing incident resolution times (MTTR), and boosting team productivity, it delivers a tangible return on investment far exceeding its cost.
Frequently Asked Questions
How long does it take to onboard?
LogLens uses familiar CLI concepts. Engineers typically pick it up in hours.
Does it integrate with existing systems?
Yes, LogLens is a local CLI tool working directly on log files. It complements log shippers and is easily scriptable.
Is it secure?
LogLens runs entirely locally. It does not send your log data to any external service, ensuring you maintain full data control.