In modern distributed systems, an incident is rarely confined to a single service. A user-facing error is often the final symptom of a complex chain reaction spanning multiple microservices. For on-call engineers, the primary challenge in reducing Mean Time To Resolution (MTTR) is correlating disparate log streams to reconstruct the event's lifecycle. Without the right tools, this process is a time-consuming exercise in manual data wrangling.
Effective incident response requires a workflow that can rapidly pivot from a high-level symptom to a low-level root cause. This post details a professional workflow using LogLens to trace a single transaction through a complex system, demonstrating how its distinct commands work in concert to accelerate root cause analysis.
The Scenario: A Failing Logistics Shipment
A major client of a Ghent-based logistics platform reports that a critical shipment has failed to schedule, providing a shipment_id. The platform's backend consists of several services, including an api-gateway, a routing-engine, partner-integrations, and a database-service, all logging to a central directory.
Step 1: Understand the Log Landscape with `fields`
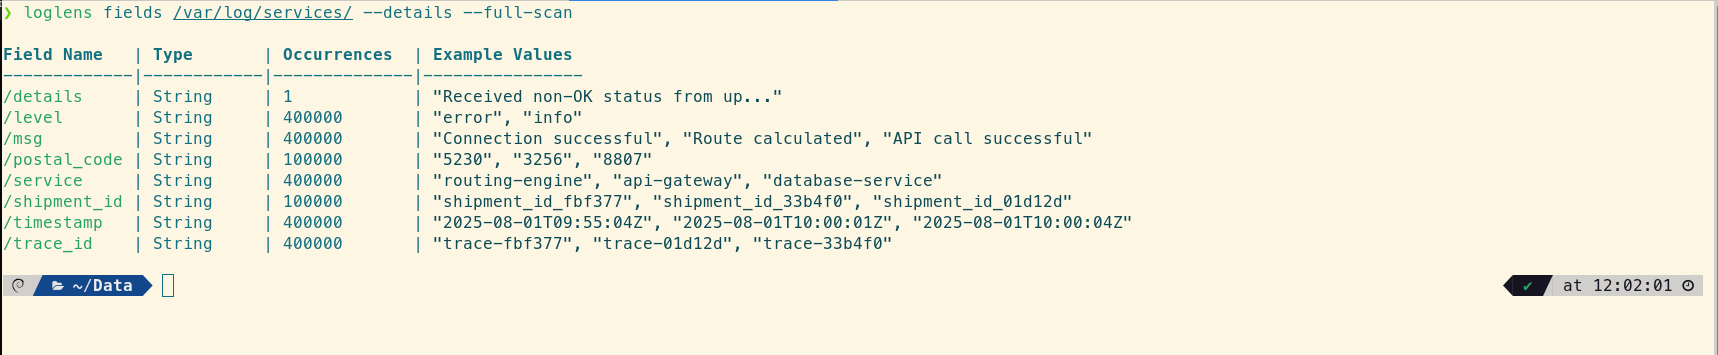
Before diving in with a specific query, a good first step is to quickly understand the structure of the log files you're dealing with. The loglens fields command reveals the different structured fields available across all services, giving you a map for your investigation.
# Get a quick view of the different fields used in the files
loglens fields /var/log/services/ --details --full-scan
We can also sample the raw logs to see the mix of formats.
# Get a quick sample of each log file to see the different formats
head -3 /var/log/services/*
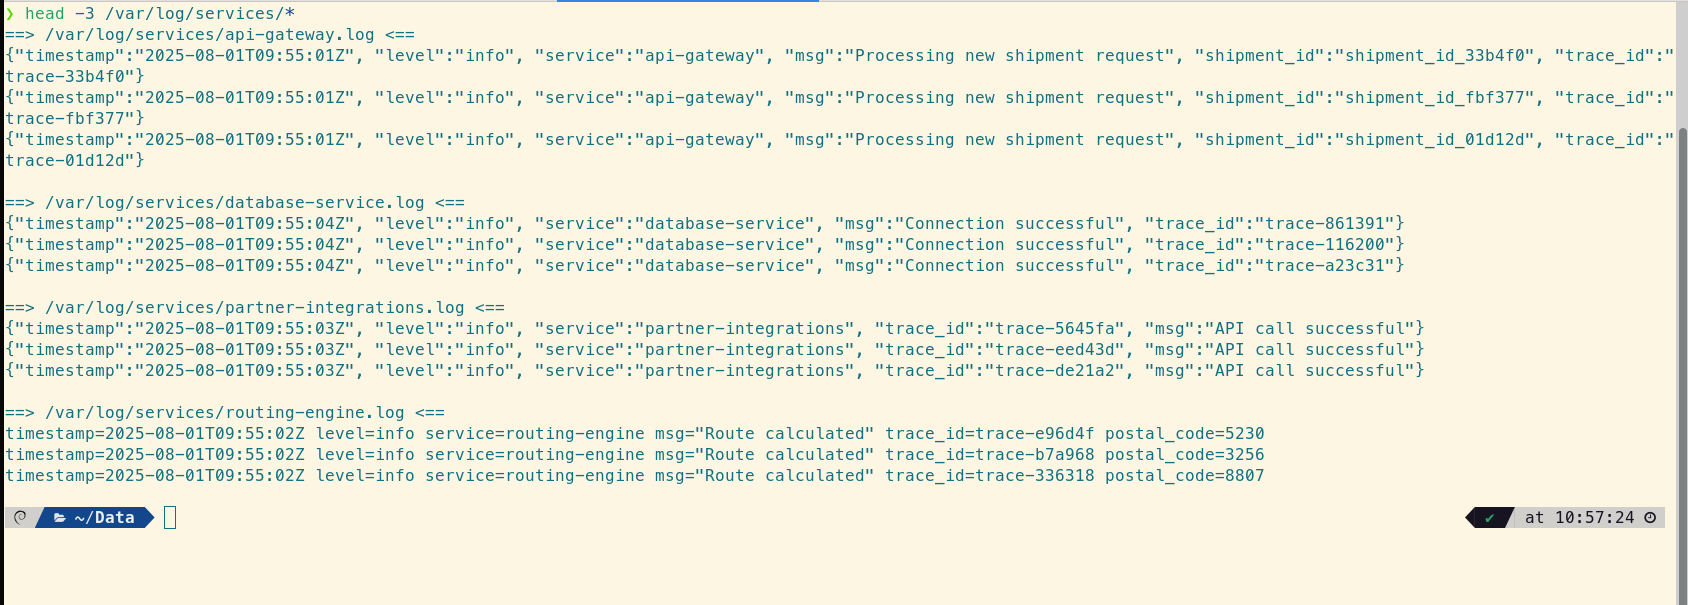
This confirms the challenge: we have structured JSON, key-value logfmt, and plain unstructured text. A tool that can handle all three simultaneously is essential.
Step 2: Find the Thread with `loglens search`
The incident starts with a single identifier. At this stage, you don't care about structure; you need raw speed to find every occurrence of that shipment_id. The free loglens search command is the perfect tool for this initial reconnaissance, as it operates like a massively parallel `grep`.
# Find the initial log entry to get the master trace_id
loglens search /var/log/ "shipment_id_abc123"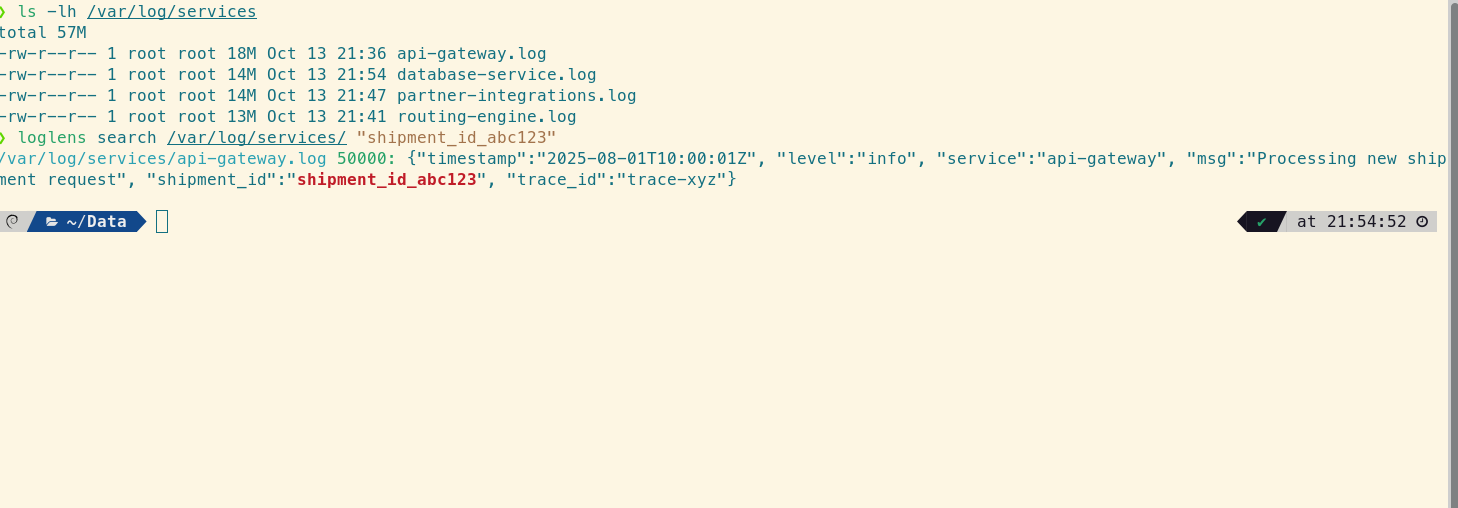
This command instantly returns the API Gateway log, revealing the crucial piece of correlating information: "trace_id": "trace-xyz". Now you have the thread to pull through the entire system.
Step 3: Isolate the Error with `loglens query` (Pro)
With the trace_id, you can perform a more precise, structured search for the error. The query command understands your log data, allowing for complex filtering. This lets you immediately identify which service first reported an error for this specific trace.
# Find the first service to report an error for this trace
loglens query /var/log/services/ 'trace_id == "trace-xyz" and level is "error"'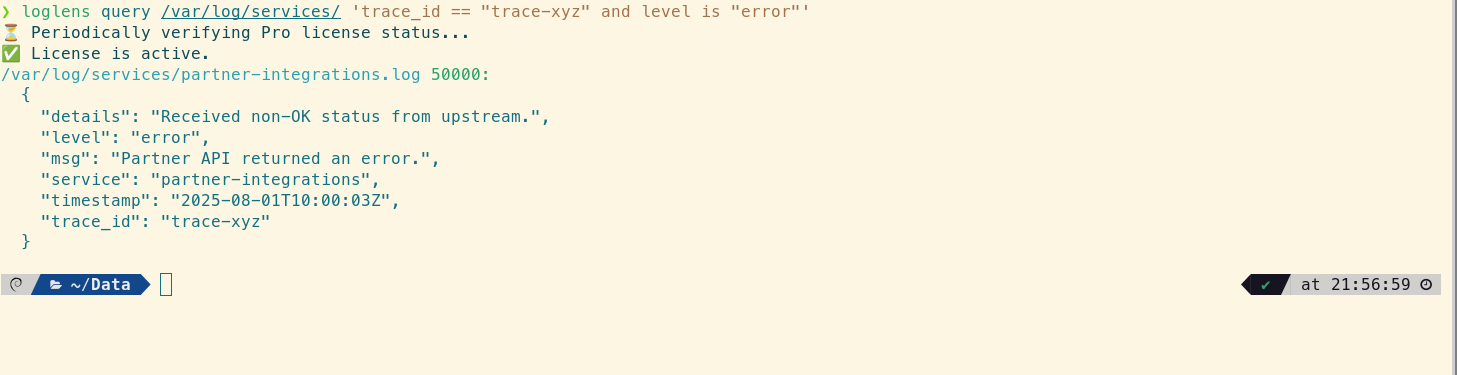
The query points directly to a log from the partner-integrations service, but the message is generic: "Partner API returned an error." To understand the root cause, you need to see what happened immediately before this error occurred.
Step 4: See the Full Story with `loglens tui` (Pro)
For the final step, you need the full context. You'll collate every log line for the trace—including INFO and DEBUG messages—into a temporary file and then open it with the interactive TUI for a chronological view.
# First, create a focused file with the full trace history
loglens search /var/log/ "trace-xyz" --raw > trace_context.log

# Now, open this file for an interactive investigation
loglens tui trace_context.log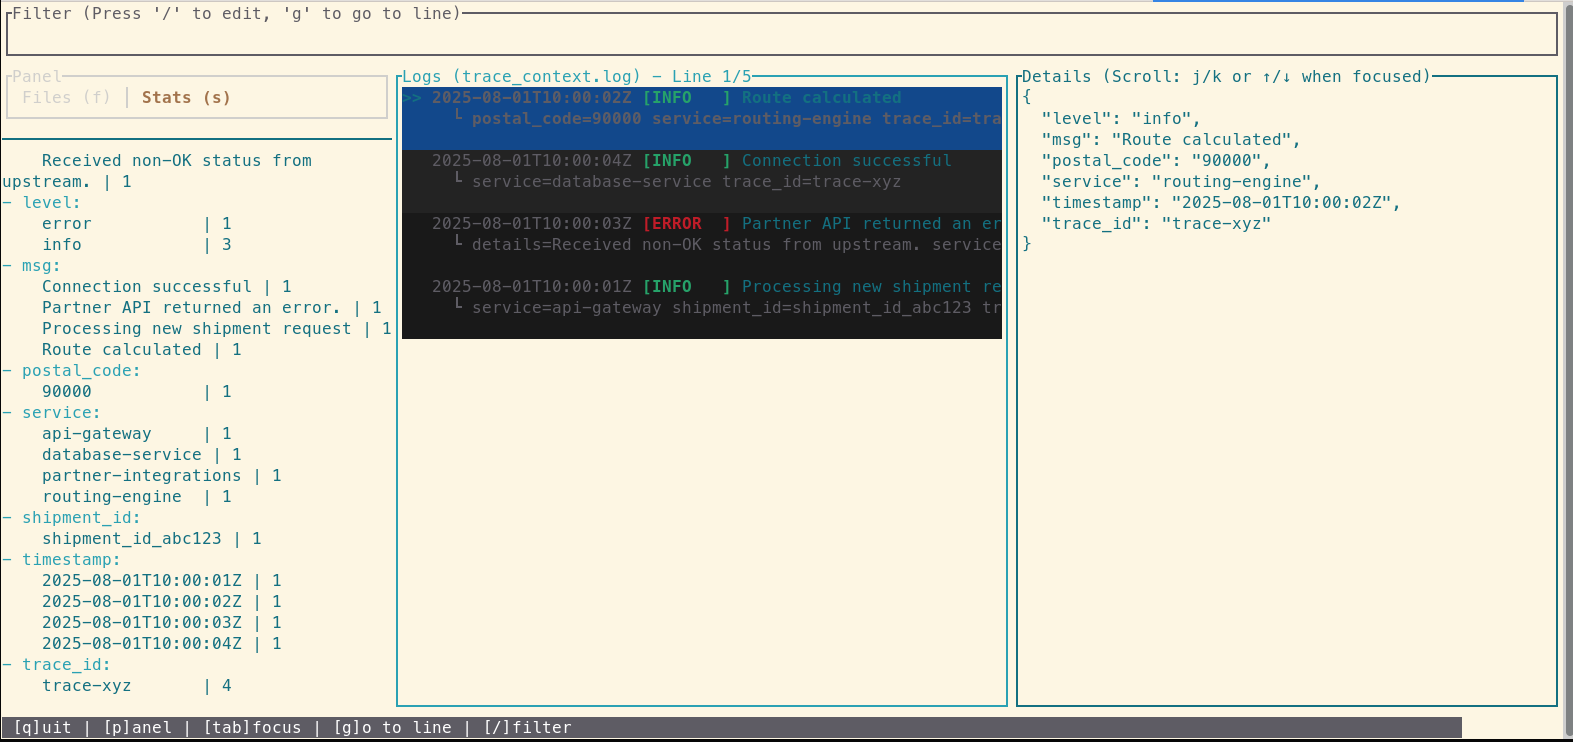
Inside the TUI, you see the entire event lifecycle in chronological order. By examining the logs right before the error, you discover the root cause: an INFO log from the routing-engine shows it processed a request with a malformed postal code. This invalid data was then passed to the partner-integrations service, causing the API call to fail. The problem wasn't in the service that reported the error, but one step upstream.
From Hours to Minutes: The Impact of a Cohesive Workflow
The issue is identified: a data sanitization bug in the routing-engine. Within minutes, the team can deploy a hotfix. MTTR was drastically reduced, and the issue was resolved before it impacted a significant number of shipments. This workflow demonstrates a clear path from a high-level customer report to a specific line of code, turning a potentially hour-long investigation into a focused, five-minute task.
Frequently Asked Questions
How does this differ from a dedicated distributed tracing system like Jaeger or Zipkin?
Dedicated tracing systems are powerful but require instrumenting your code with specific SDKs. This LogLens workflow is designed for the reality where not every service is (or can be) perfectly instrumented. It works directly on your existing logs, using a shared `trace_id` as the correlation key, making it a flexible and immediately useful tool for any microservice architecture.
What if my services don't all have a `trace_id`?
While a `trace_id` is the gold standard, this workflow is still highly effective. You can use any shared identifier, such as a `user_id`, `request_id`, or `order_id`, to correlate logs. The key is to find one piece of information that links the services involved in a transaction.
Can `loglens query` work on the unstructured text logs?
Partially. When using `query` on unstructured logs, it behaves like a powerful text search. You can use queries like `'text contains "Invalid postal code"'` to find specific lines. However, to use field-based conditions like `level == "error"`, the logs must have a recognized structure (JSON or logfmt).