The most challenging bugs aren't ones that crash the system. They're the silent performance killers—the subtle, intermittent slowdowns that degrade user experience, evade basic alerting, and force engineers into a cross-service forensic nightmare. This is a story about one such bug, and how the complete LogLens toolkit transformed a multi-hour investigation into a precise, surgical operation.
The Alert: A Faint Whisper of Trouble
It begins not with a bang, but with a PagerDuty alert at 2 AM: "P95 Latency for `/api/v1/products/list` has breached the 500ms warning threshold." There are no 5xx errors, no circuit breakers tripping, just a quiet, persistent slowness. The on-call engineer, Alex, opens the monitoring dashboard. The graph confirms it: a slow, steady creep in response times over the last hour. The problem is real, but the dashboard offers no "why." The API gateway talks to dozens of microservices. The hunt begins.
[Image of microservices architecture request flow with api gateway]The logs from our services are stored in a central `/logs/` directory, containing `api-gateway.log`, `product-service.log`, and `recommendation.log`.
Step 1: Get a Real-Time Pulse with `watch`
Before diving into historical data, Alex wants to see the problem live. Is it still happening? The LogLens Pro watch command is the perfect tool to get a live, filtered stream of what's happening right now. Alex decides to watch the gateway log, filtering for any requests that are taking longer than the 500ms threshold.
# Watch the live log stream for any requests taking longer than 500ms
loglens watch /logs/api-gateway.log --where 'latency_ms > 500'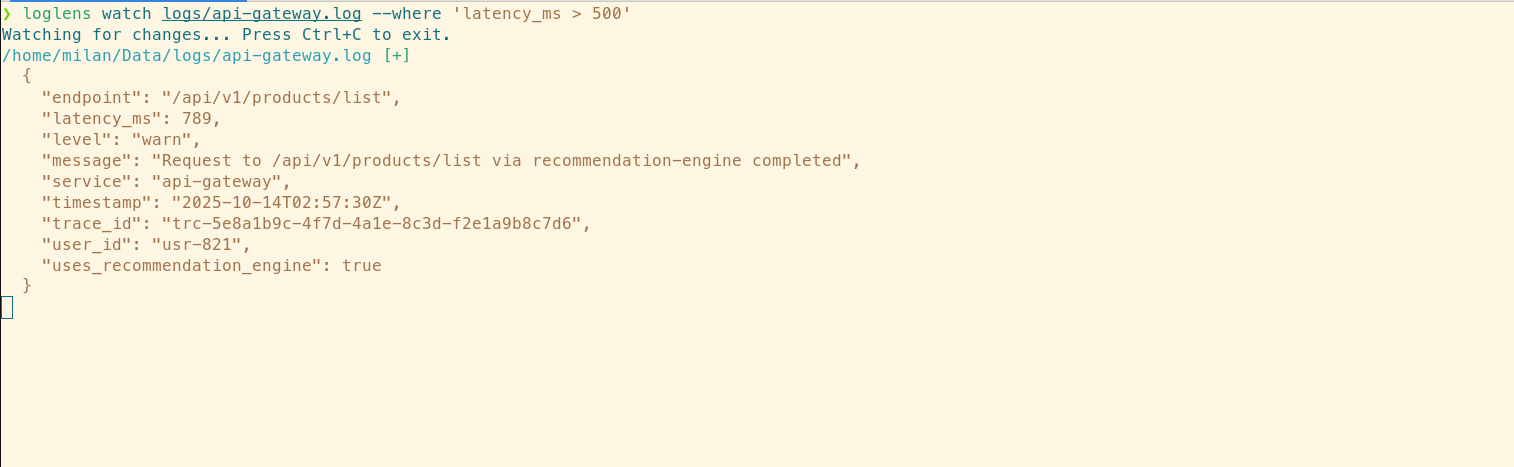
Immediately, slow requests pop up on the screen. It's happening now. From the structured output, Alex notices a pattern: many of the slow requests seem to have fields related to a new, experimental `recommendation-engine`. A suspect has emerged.
Step 2: Map the Log Data with `fields`
Now that the `recommendation-engine` is a suspect, Alex needs to understand what kind of data its logs contain before trying to query it. The fields command is designed for exactly this kind of reconnaissance. It scans the log file and reports on all available fields, their data types, and example values.
# Discover all available fields in the suspect log file to guide the investigation
loglens fields /logs/recommendation.log --details --sort-by count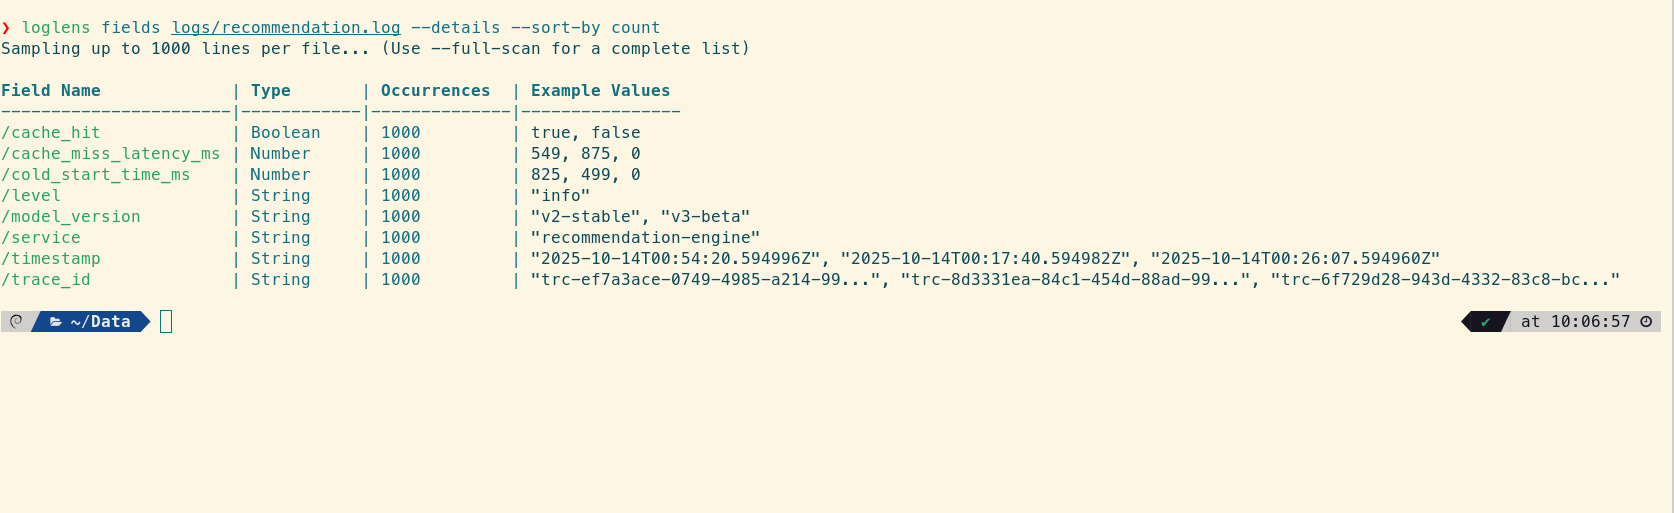
The output is a perfect map for the next steps. Alex can see promising fields like model_version (Categorical), cache_hit (Boolean), and, most importantly, several numeric latency fields like cache_miss_latency_ms and cold_start_time_ms. This isn't guesswork anymore; it's a data-driven investigation.
Step 3: Establish Scope with `search`
With a suspect service and a map of its fields, Alex wants to understand the scope. How often is this service involved across the system? A simple, blazing-fast search across the entire log directory for the term "recommendation-engine" will provide a quick historical overview.
# Find every mention of the suspect service in all log files
loglens search /logs/ "recommendation-engine"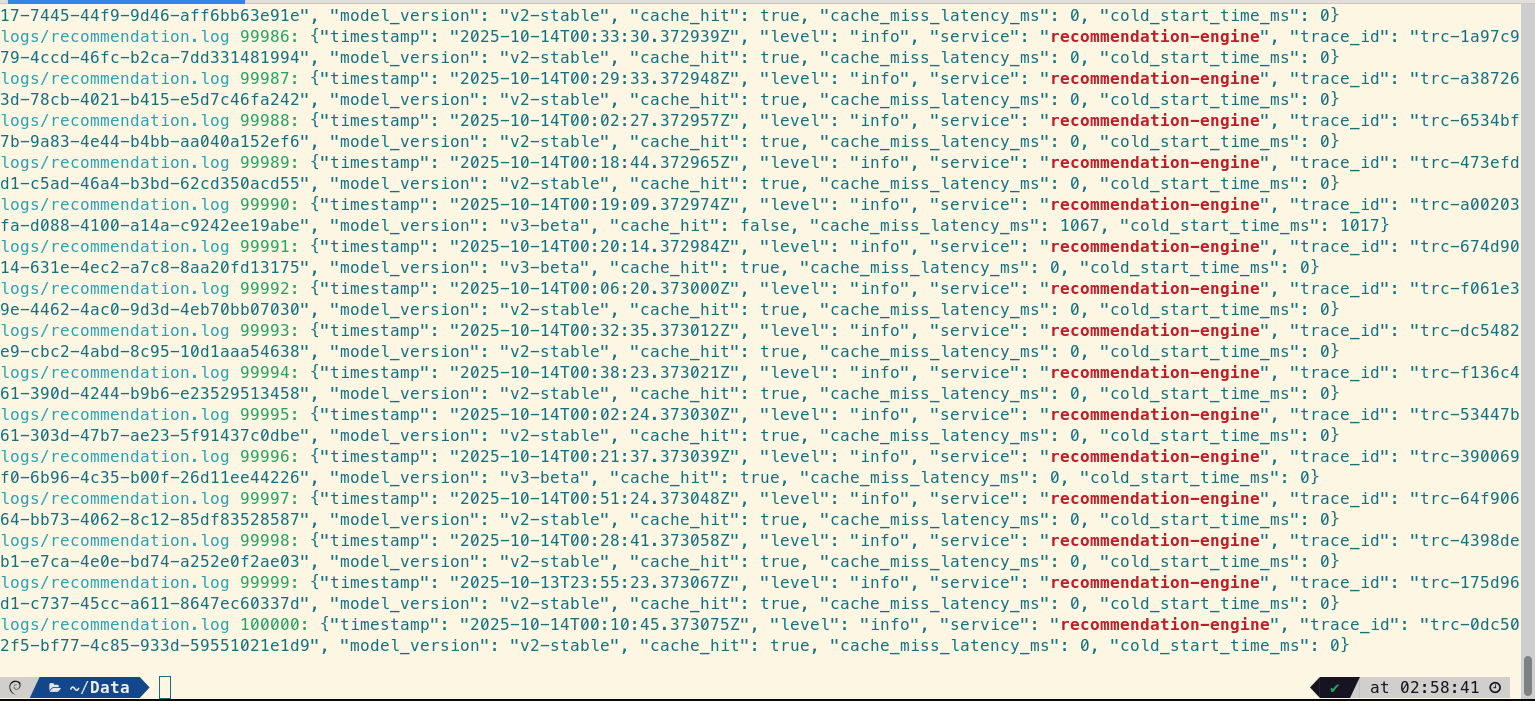
The results pour in. The service is mentioned in logs from the `api-gateway` and, of course, its own `recommendation.log`. This confirms the interaction but doesn't yet prove causality. Alex needs to connect a slow gateway request to a specific action within the recommendation service.
Step 4: Quantify the Problem with `count`
Before diving deeper, a quick sanity check. How many of these slow requests have there been in the last hour? The LogLens Pro count command provides a single number, fast.
# Get a hard number of slow requests in the last hour
loglens count /logs/api-gateway.log 'latency_ms > 500' --since "1h ago"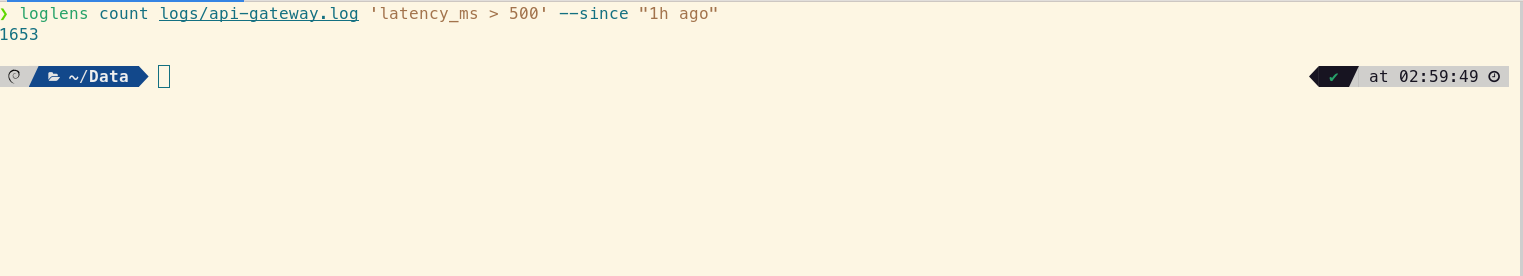
The number is high enough to warrant a full investigation. This isn't a transient blip.
Step 5: Correlate and Trace with `query`
This is the critical step. Alex needs to find a `trace_id` from a slow request in the gateway and use it to follow the request's entire lifecycle. The LogLens Pro query command is built for this, allowing for complex, structurally-aware filtering.
# Find a specific slow log entry to extract its trace_id
loglens query /logs/api-gateway.log 'latency_ms > 800' --since "1h ago" --json | head -n 5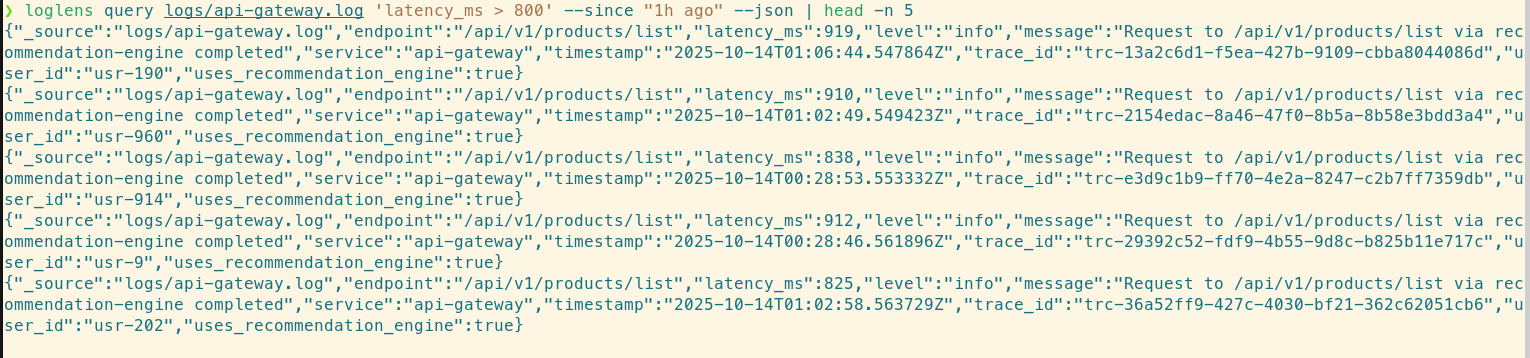
Alex grabs a `trace_id` from the output: `trc-13a2c6d1-f5ea-427b-9109-cbba8044086d`. Now, a second `search` command acts as a universal cross-service `grep`, instantly pulling all log lines from all files that contain this ID.
# Use the trace_id to find all related logs across all services
loglens search /logs/ "trc-13a2c6d1-f5ea-427b-9109-cbba8044086d"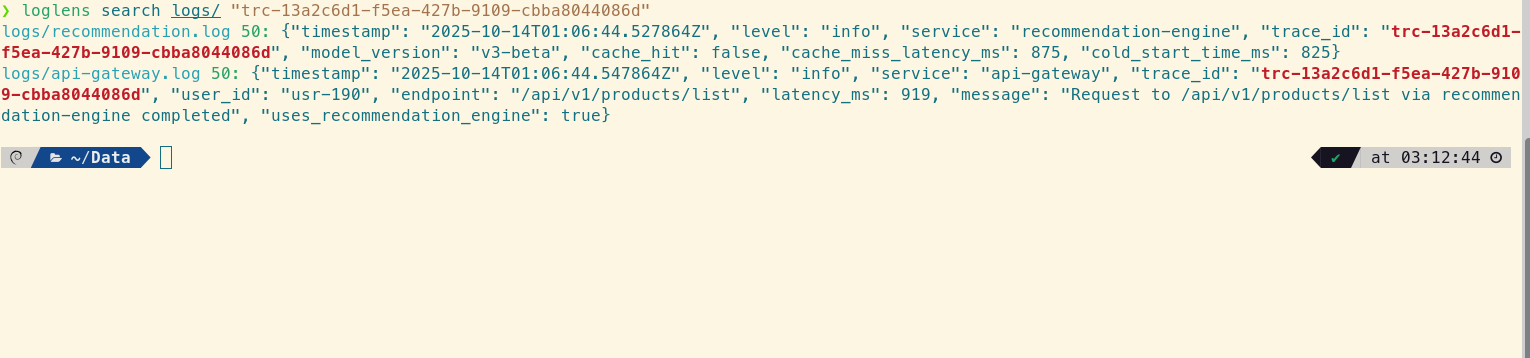
The story becomes clear. The timestamps are milliseconds apart, showing a direct link between the gateway seeing a high latency (`919ms`) and the recommendation service performing a slow operation (`875ms`). The bottleneck is definitively inside the `recommendation-engine`.
Step 6: Pinpoint the "Why" with `stats`
Now the focus shifts entirely to `recommendation.log`. Alex knows *what* is slow, but needs to prove *why*. Armed with the knowledge from the `fields` command, Alex can use the enhanced LogLens Pro stats command to dissect the performance profile with surgical precision.
First, describe the suspect field. A high-level statistical profile of `cache_miss_latency_ms` reveals the nature of the problem.
loglens stats describe /logs/recommendation.log cache_miss_latency_ms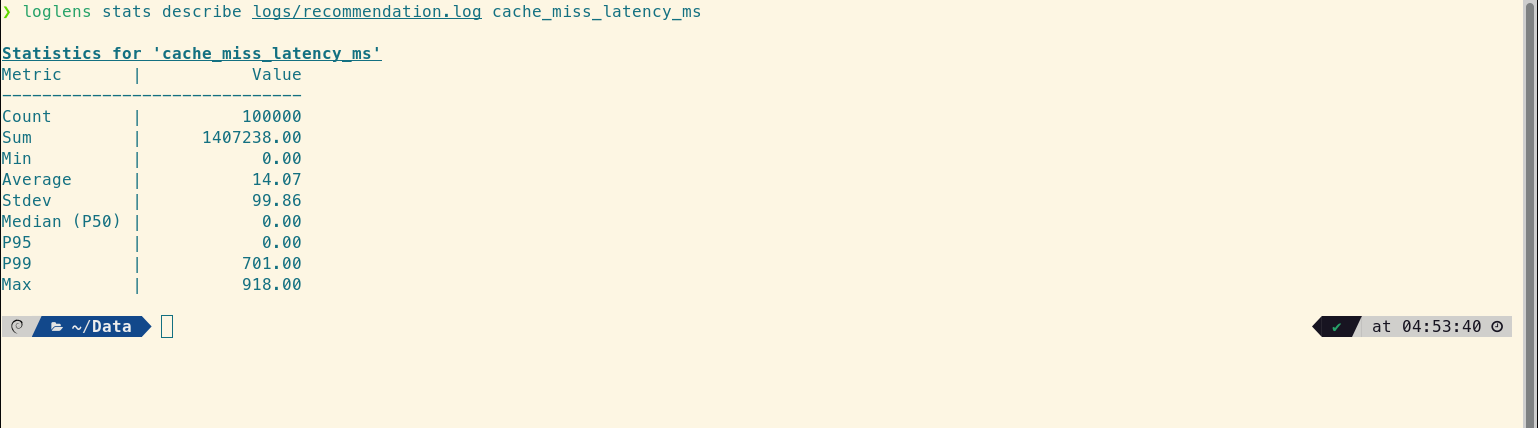
The output is a goldmine. The `Average` (14.07ms) is deceptively low, but the Median (P50) and P95 are both 0.00. This is a crucial insight: at least 95% of requests are perfectly fast. However, the P99 jumps to 701.00ms.
This proves the issue is a classic "long-tail" problem, where a small fraction of requests are incredibly slow, dragging up the P95 alert without significantly impacting the average.
Next, group-by to find the source of the long tail. Alex needs to see if this long tail is associated with a specific `model_version`.
loglens stats group-by /logs/recommendation.log --by model_version --avg cache_miss_latency_ms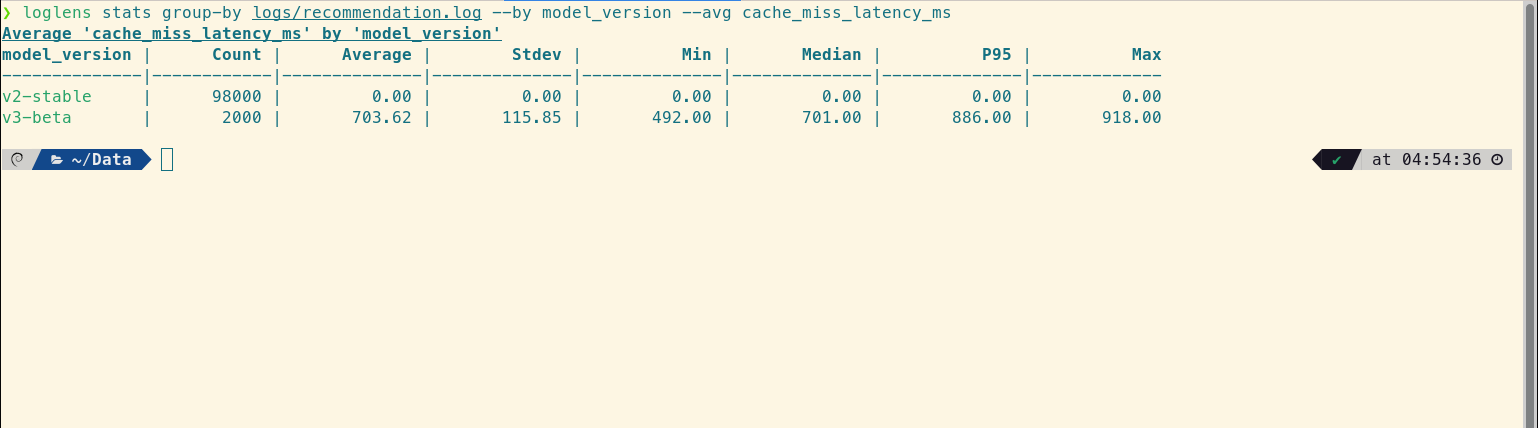
The smoking gun. The `v2-stable` model is flawless. The `v3-beta` model, however, is the entire problem. Its `Median` latency is already a massive 701ms, and its `P95` is 886ms. This confirms that the entire long tail of slow requests is composed almost exclusively of `v3-beta` traffic.
Finally, a quick check with `legacy`. How much traffic is this new model even getting?
loglens stats legacy /logs/recommendation.log --count-by model_version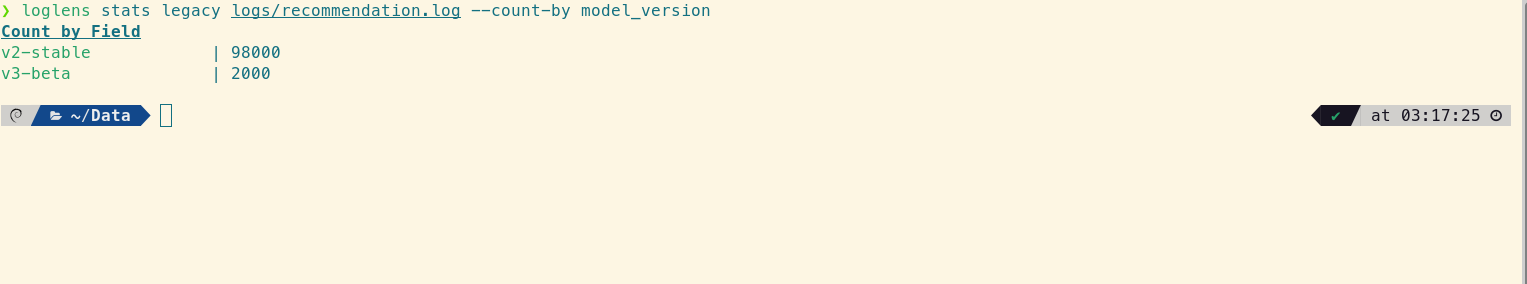
It confirms the `v3-beta` model is active and serving enough requests to trigger the system-wide P95 alert.
Step 7: Final Confirmation with `tui`
Alex now knows the `v3-beta` model's cache misses are the source of the P99 latency, but not the final why. For this, nothing beats the LogLens Pro tui for interactive, visual log exploration.
loglens tui /logs/recommendation.logInside the TUI, Alex applies a filter for 'model_version == "v3-beta" AND cache_hit == false'. The list instantly updates to show only the problematic log entries. Clicking on one reveals the full JSON detail.
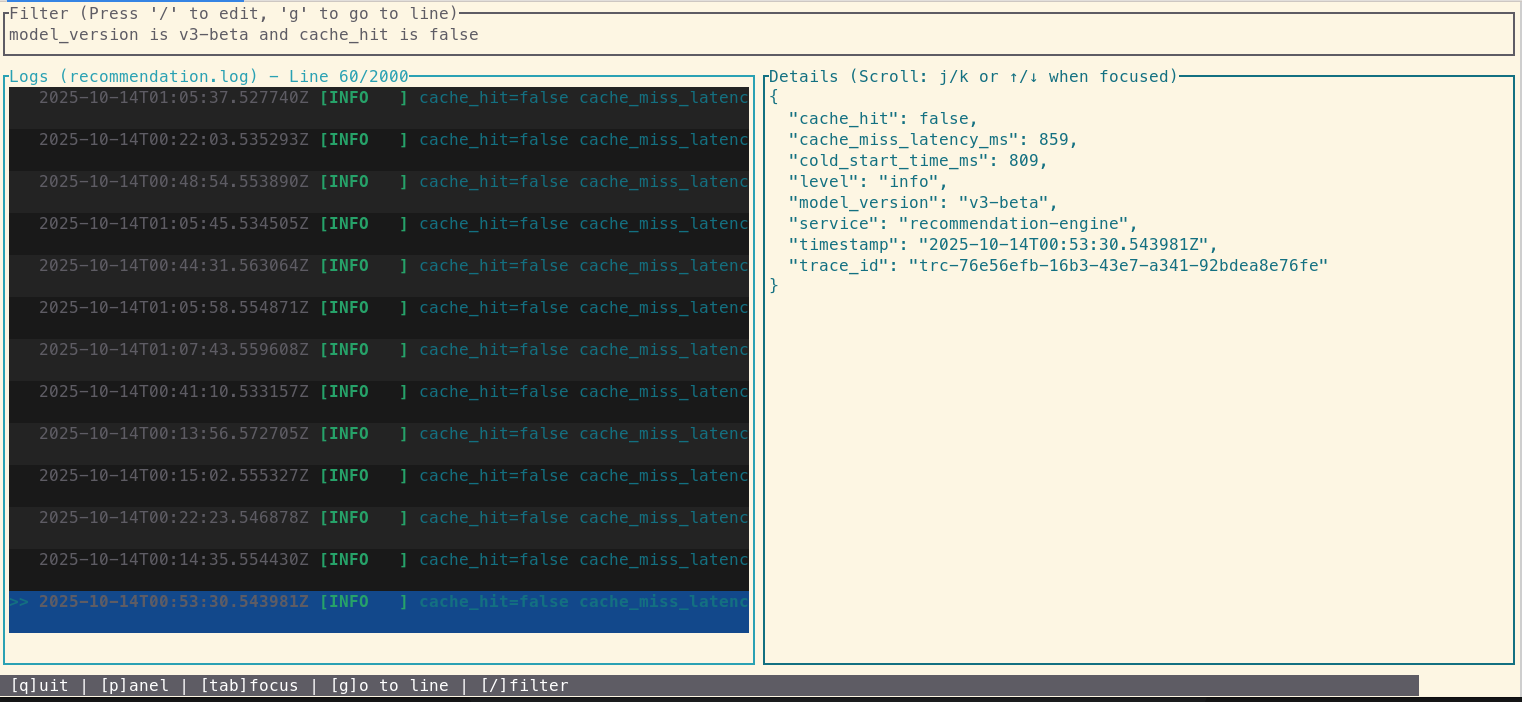
And there it is. A field named cold_start_time_ms with a value of over 800ms. The new `v3-beta` model is so large that on a cache miss, the time it takes to load the model into memory for the first time is causing the massive latency spike that ripples all the way up to the user. The mystery is solved.
Step 8: Resolution and Log Rotation with `compress` / `decompress`
With the root cause identified, the team disables the feature flag for the `v3-beta` model. Latency immediately returns to normal. As part of the cleanup, Alex needs to archive the massive log files from the incident.
# Archive the log files to save space
loglens compress /logs/api-gateway.log
loglens compress /logs/recommendation.log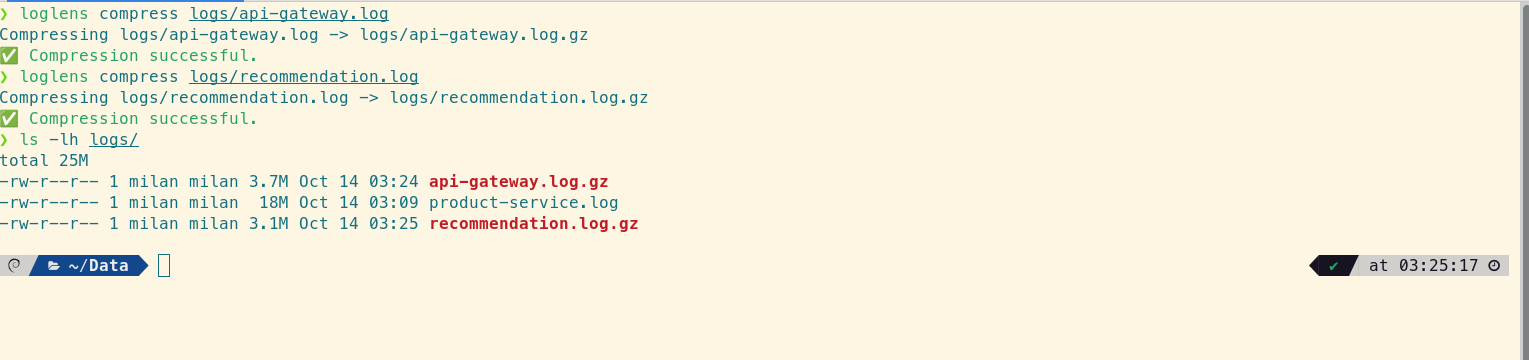
The next day, during the post-mortem, the team wants to review the raw logs again. decompress makes it trivial.
# Decompress for post-mortem analysis
loglens decompress /logs/recommendation.log.gz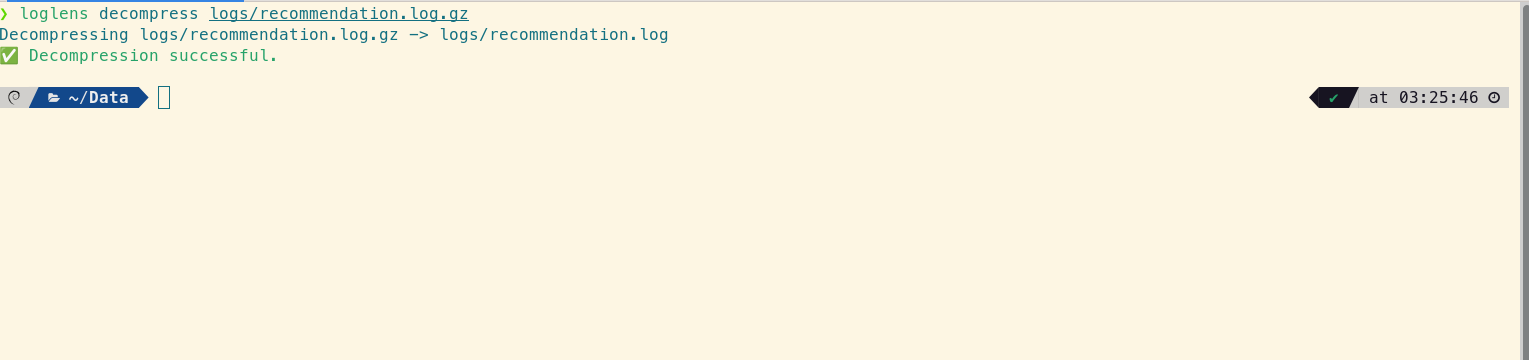
Step 9: Staying Ahead with `license` and `update`
This deep, multi-faceted investigation was only possible because of the advanced features in LogLens Pro. Alex runs a quick license status to ensure the team's license is active.
loglens license status
Finally, to ensure access to the latest features and performance improvements, Alex runs update.
loglens update
From Hours to Minutes: The LogLens Advantage
Without a cohesive toolset, this investigation could have taken hours, involving multiple engineers, SSHing into boxes, and stitching together data from disparate systems. With LogLens, a single engineer was able to go from a vague alert to a precise root cause in minutes, all from the command line. By providing not just averages, but critical percentiles, LogLens speaks the language of modern observability and pinpoints the long-tail issues that impact real users.
Frequently Asked Questions
How is this workflow faster than using a monitoring dashboard?
Dashboards are excellent for showing the "what" (e.g., latency is high) but often fail at showing the "why." This LogLens workflow allows you to instantly pivot from a high-level aggregate view (like in `stats`) directly to the specific, individual log lines (`query`, `search`, `tui`) that are causing the problem, without ever leaving your terminal.
What if my `trace_id` is in a nested JSON field?
No problem. The LogLens query engine understands nested JSON. You can query nested fields using a JSON Pointer path, like --where '/context/trace_id == "trc-..."', making it easy to correlate logs no matter how they are structured.
Can I perform this analysis on compressed `.gz` files?
Yes. All LogLens commands, including `search`, `query`, `stats`, and `fields`, can read directly from `.gz` files without needing to be manually decompressed first. This saves significant time and disk space during an investigation.