Data Transfer (Egress) fees are the silent killer of cloud budgets. You might optimize your EC2 instances and reserve your RDS capacity, but a single unoptimized API endpoint returning a 5MB JSON payload can rack up thousands of dollars in "Data Transfer Out" fees on AWS, Azure, or Google Cloud.
The solution isn't to guess which image is too large; it's to analyze your Nginx logs. Nginx records the exact size of every response in bytes (body_bytes_sent). The challenge is aggregating this data to find the worst offenders.
Here is how to use LogLens to audit your bandwidth usage and find optimization opportunities in minutes.
Understanding `body_bytes_sent`
Nginx logs usually follow the "Combined" format, which includes the response size in bytes. LogLens automatically detects this field.
# Standard Nginx Log Example
127.0.0.1 - - [18/Dec/2025:10:00:00 +0000] "GET /api/users HTTP/1.1" 200 5242880 ...
In the example above, 5242880 is the body_bytes_sent. That's 5MB for a single request! If that endpoint gets hit 1,000 times an hour, you are pushing 5GB of traffic per hour from just one URL.
1. Calculate Total Data Transfer
First, let's look at the big picture. We can use the stats describe command to see the sum total of bytes sent over the logged period.
# Get stats for the body_bytes_sent field
loglens stats describe access.log body_bytes_sent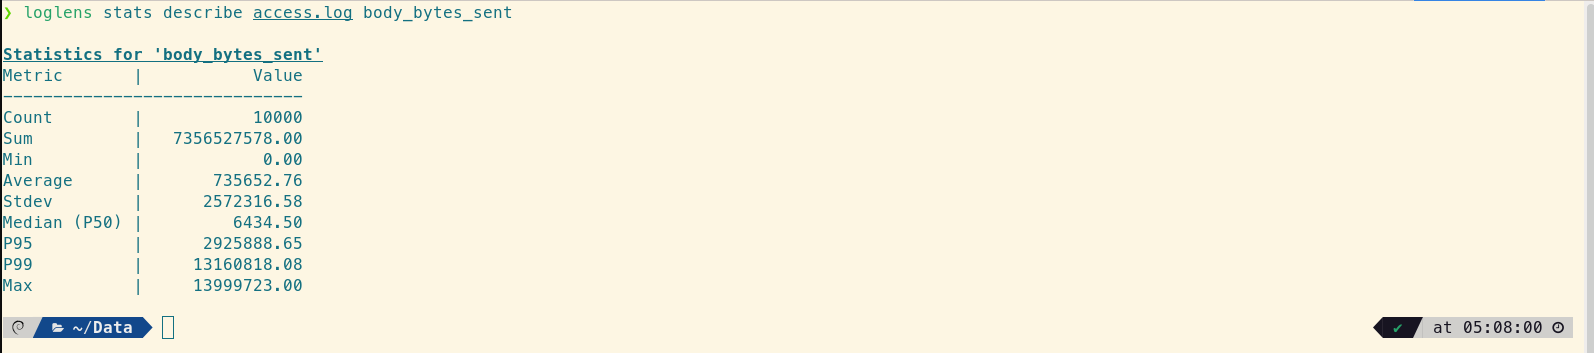
The "Sum" field tells you exactly how much data Nginx served.
Look at the Sum. Convert that bytes figure to GB or TB. Does it match what your cloud provider is charging you for?
2. Identify the Heaviest Endpoints
Now for the most valuable step: blaming specific endpoints. We want to group by the request path and calculate the average and maximum size of the response.
# Group by Path, Calculate Average Size
loglens stats group-by access.log \
  --by path \
  --avg body_bytes_sent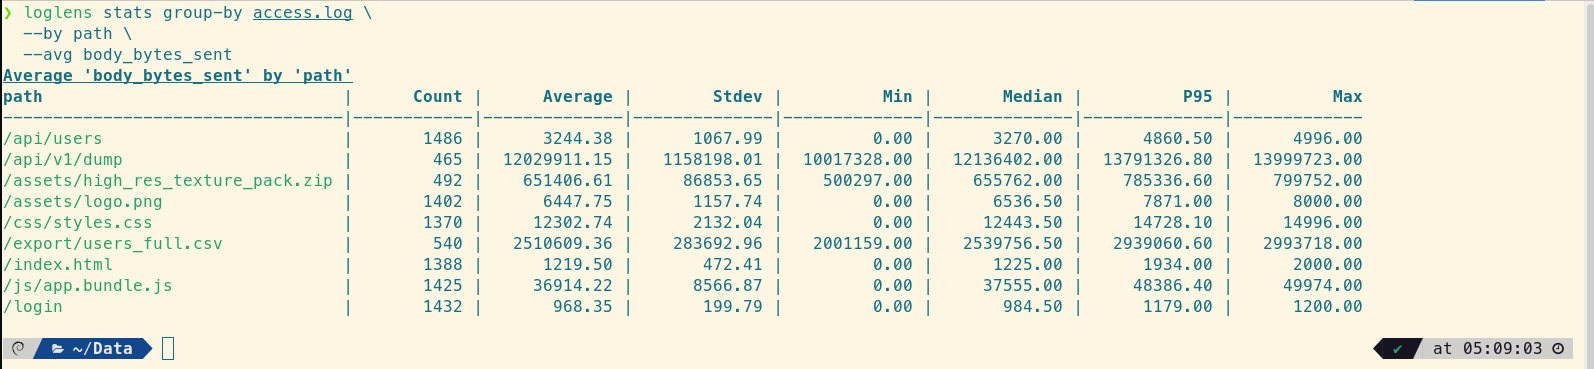
Found it! The `/api/v1/dump` endpoint is returning 12MB on average.
What to look for:
- High Average, High Count: These are your budget killers. Optimize these first (pagination, compression).
- Low Average, Massive Max: This indicates an outlier. Perhaps a specific user requested "all time" data in a report.
3. Hunt for Uncompressed Responses
Sometimes, Nginx Gzip compression isn't working for certain content types (like huge JSON blobs), resulting in massive bandwidth waste.
We can filter for large responses and inspect them. If you see text-based content (JSON, HTML, CSV) with high byte counts, check your gzip_types config in Nginx.
# Find responses larger than 1MB
loglens query access.log 'body_bytes_sent > 1048576' --raw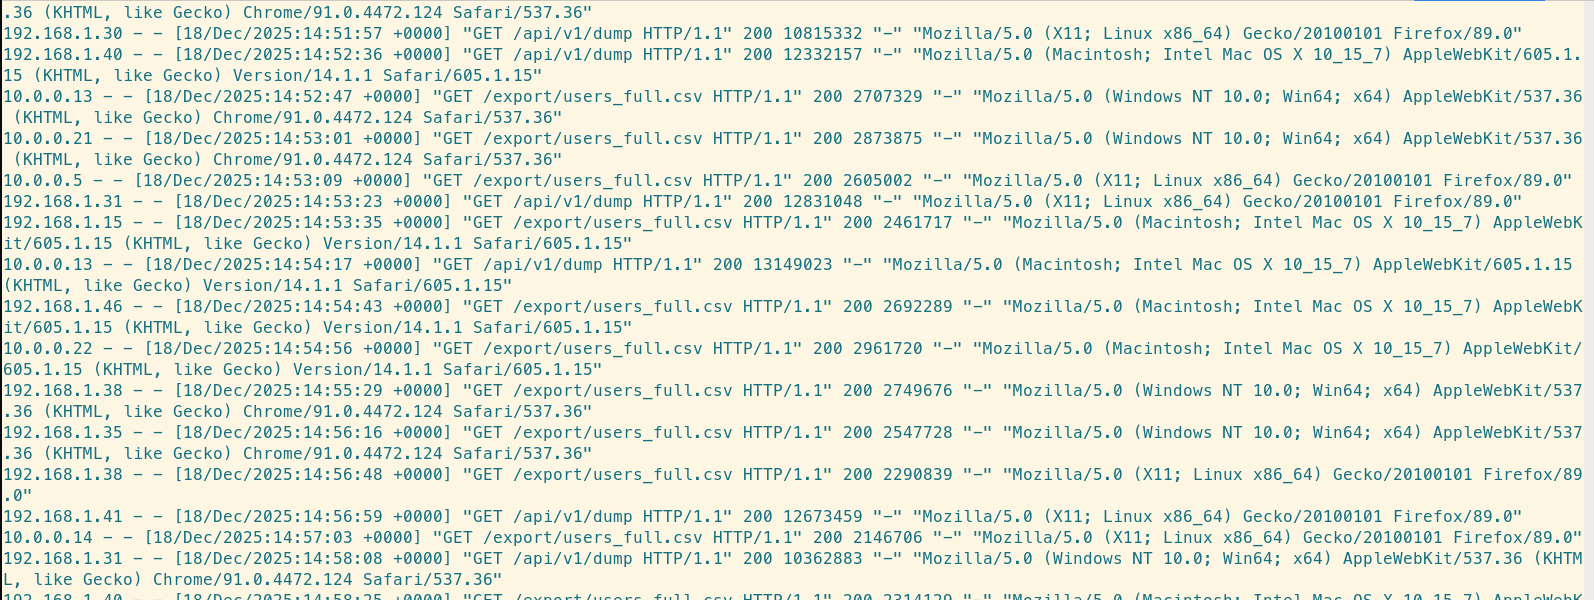
4. Detect "Scraper" Bandwidth Theft
Sometimes, your bandwidth isn't being used by customers, but by scrapers downloading your assets repeatedly. By grouping the large requests by IP, we can find these actors.
# Who is downloading the most data?
loglens stats group-by access.log \
  --where 'body_bytes_sent > 500000' \
  --by remote_addr \
  --avg body_bytes_sent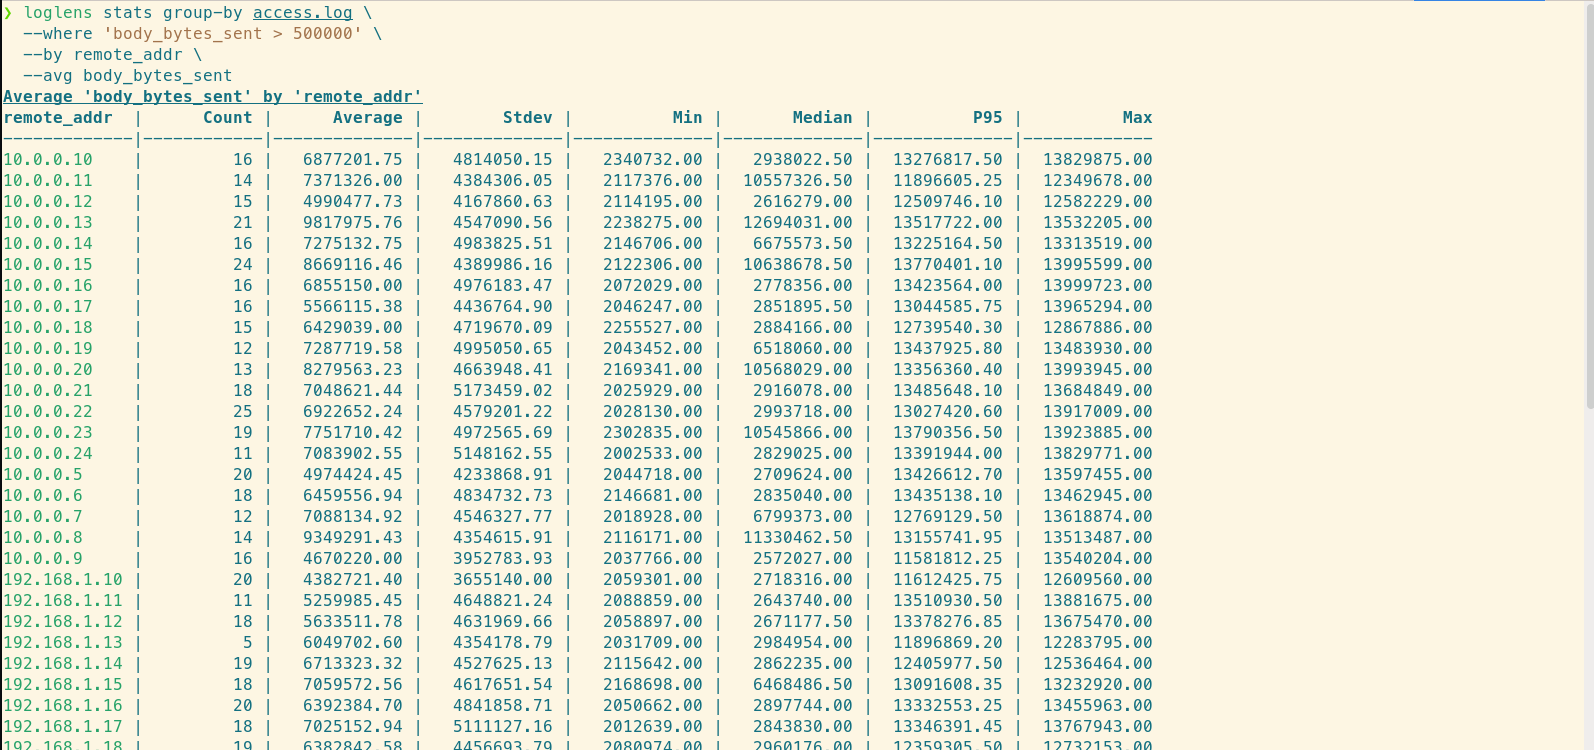
If one IP address appears at the top with thousands of large downloads, block them.
Summary
You don't need to wait for the end-of-month AWS bill to optimize your costs. Your Nginx logs tell you exactly where the money is going.
- Use
stats describeto audit total transfer. - Use
stats group-byto find unoptimized endpoints. - Query for large responses to validate Gzip compression.