It’s 7:30 AM. An alert fires: the P95 latency for the critical `checkout-api` has breached its Service Level Objective (SLO). High-level dashboards confirm the problem—a spike in response times—but offer no explanation as to the cause. For any on-call engineer, this is the start of a race against time. The key to winning that race is Mean Time To Resolution (MTTR), and the biggest variable is how quickly you can extract actionable signals from your logs.
This is a story of two timelines. One involves the slow, cumbersome process of traditional command-line tools. The other demonstrates the speed and clarity that loglens stats brings to incident response.
The Traditional Workflow: A 45-Minute Manual Investigation
Without a specialized tool, the process is painfully manual:
- (10-15 min) Download & Decompress: Pull down a multi-gigabyte compressed log archive from cloud storage and wait for
gunzipto churn through it. - (20-30 min) Iterative Grepping: Start a frustrating cycle of piping
grep,awk, andsedtogether, slowly building a complex one-liner to isolate error logs, extract latency values, and manually calculate an average. It's slow, error-prone, and provides only surface-level insights.
After nearly 45 minutes of stressful scripting, you might have a rough idea of the problem, but you lack the statistical confidence to declare a root cause.
The LogLens Workflow: A 5-Minute Path to Root Cause
Let's restart the clock. The alert fires. The log archive is downloaded. Instead of `gunzip` and `grep`, our engineer, Alex, uses LogLens. Total time elapsed: under 5 minutes.
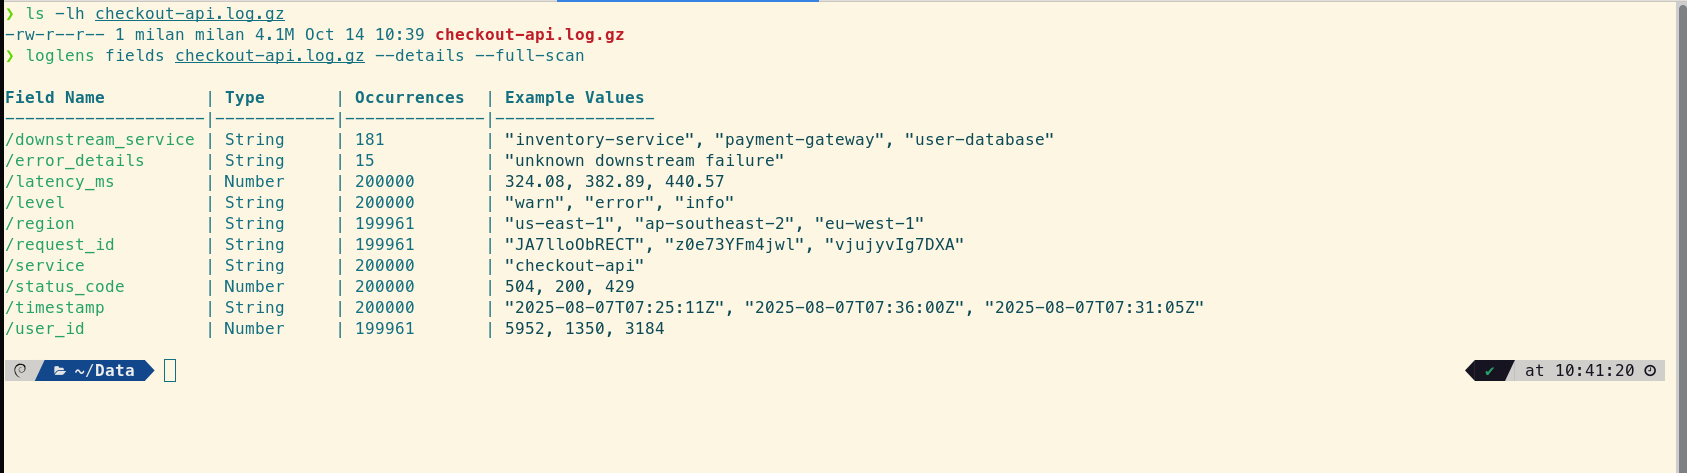
Step 1: Understand the Log Data with `fields`
Before diving in, Alex needs to know what the data looks like. The logs from `checkout-api` are structured JSON. A quick `loglens fields` command confirms the format and available fields to query.
Step 2: Isolate the Failing Service with `stats legacy` (Pro)
Alex's first hypothesis is that one of the API's downstream dependencies is failing. A single `stats legacy` command can test this by grouping all failed checkouts by the service they were calling and calculating their average latency.
# For all failed checkouts, group by downstream service and find the average latency
loglens stats legacy ./checkout-api.log.gz --count-by "downstream_service" --avg "latency_ms" --where 'status_code >= 500'
In under twenty seconds, Alex gets a clear result:
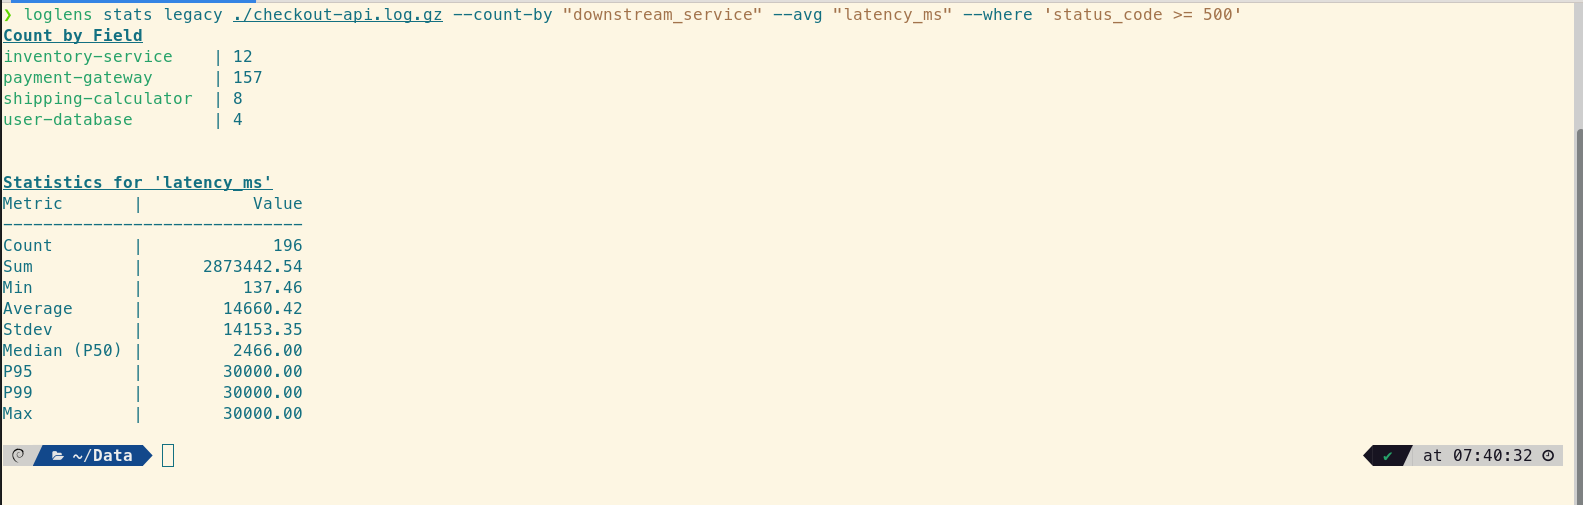
The signal is unmistakable. The `payment-gateway` is responsible for the vast majority of failures. But the real insight lies in the statistical summary. Alex immediately sees two red flags:
1. The `Average` latency (14,660ms) is nearly six times higher than the `Median` (2,466ms). This massive skew proves the average is being distorted by a smaller number of extremely slow requests.
2. The `P95` and `P99` are both exactly 30,000ms. This is the smoking gun: at least 5% of all failed requests are hitting an identical, round-number maximum—the tell-tale sign of a hard timeout.
Step 3: Confirm the Timeout with `stats describe` (Pro)
The payment gateway is clearly the problem. To confirm the timeout theory, Alex needs a detailed statistical picture of just the failing service's latency using `stats describe`.
# Get a full statistical breakdown for only the failing payment gateway calls
loglens stats describe ./checkout-api.log.gz latency_ms --where 'downstream_service == "payment-gateway" AND status_code >= 500'
This command provides the critical "aha!" moment:
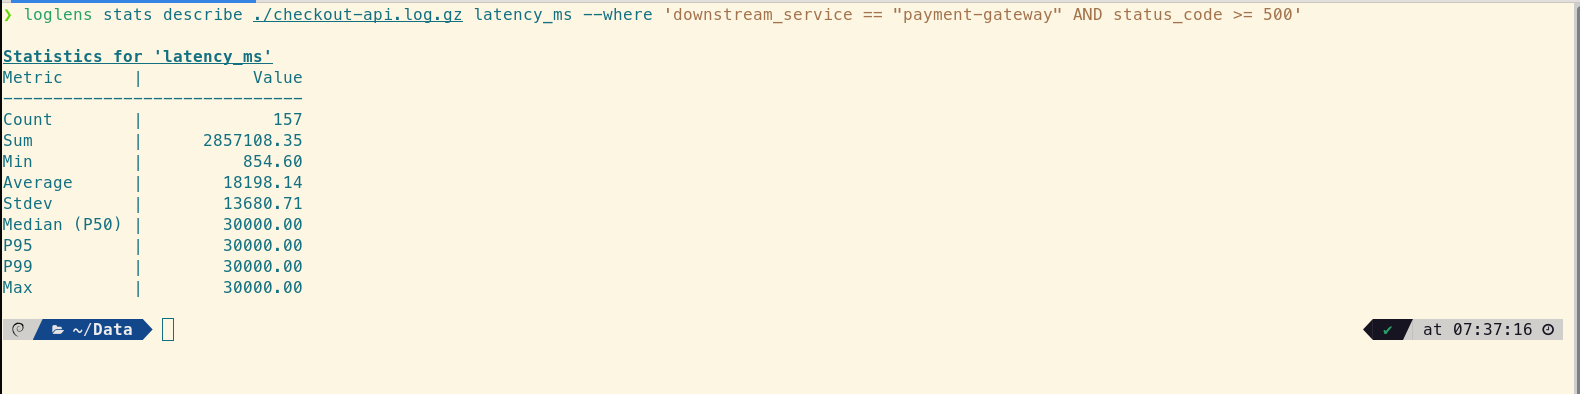
This data tells a devastating story. The `Median (P50)` latency is now 30,000ms. This isn't just an outlier problem anymore; more than half of the failed requests to the payment gateway are hitting the hard 30-second network timeout. The `Average` is actually lower than the median because a few faster failures are pulling it down, but the central tendency is clear: the system is bottlenecked and timing out consistently.
From Guesswork to Certainty, in Minutes
In less than five minutes, using just two commands, Alex has moved from a high-level P95 alert to a precise, actionable diagnosis: "The checkout API is failing because the majority of calls to the payment gateway are hitting a 30-second network timeout." The team now knows exactly where to look—not at their own code, but at the network configuration or the health of the payment gateway itself.
This is the strategic advantage of a purpose-built tool. It transforms logs from a passive archive into an active, queryable dataset, empowering engineers to move from guesswork to statistical certainty in minutes.
Frequently Asked Questions
Why are percentiles (P50, P95, P99) more important than averages?
Averages can be misleading. A few extremely slow requests (the "long tail") can dramatically skew the average, while the experience for most users might be fine. Percentiles, especially P95 and P99, give you a much more accurate picture of the user experience at the edges, which is often where problems first appear.
Can `loglens stats` read compressed logs directly?
Yes. All LogLens commands, including `stats`, can operate directly on Gzip-compressed (`.gz`) files. You don't need to decompress them first, which saves a significant amount of time and disk space during an incident.
What's the difference between `stats legacy` and `stats describe`?
stats legacy is a flexible, multi-purpose command that lets you combine different aggregations (like counting by a category and averaging a number) in one go. stats describe is a specialized command that provides a deep, comprehensive statistical profile (count, sum, min, max, stdev, and multiple percentiles) for a single numeric field.
Upgrade to LogLens Pro for Faster MTTR Read the Stats Command Docs