What Problems Can You Solve with LogLens?
LogLens is more than a tool; it's a collection of high-speed workflows designed for the toughest challenges in modern software development. See how you can solve critical issues in minutes, not hours.
Blazing-Fast Incident Response
When production is down, every second matters. Go from a high-level alert to a precise root cause with a workflow designed to slash your Mean Time To Resolution (MTTR). Instantly analyze performance spikes and error rates to understand the blast radius of an outage.
# Get a full statistical breakdown of failing requests during an outage
loglens stats describe incident.jsonl latency_ms --where 'status_code >= 500'
Understand Unfamiliar Logs in Seconds
Dropped into a new project? Get an instant, high-level overview of any log directory. The summary command automatically discovers fields, calculates statistics, and shows you the time range of your data, giving you a complete picture without reading a single line of code.
# Get an automatic summary of an entire directory of logs
loglens stats summary logs/
Instantly Understand the "Why" Behind Errors
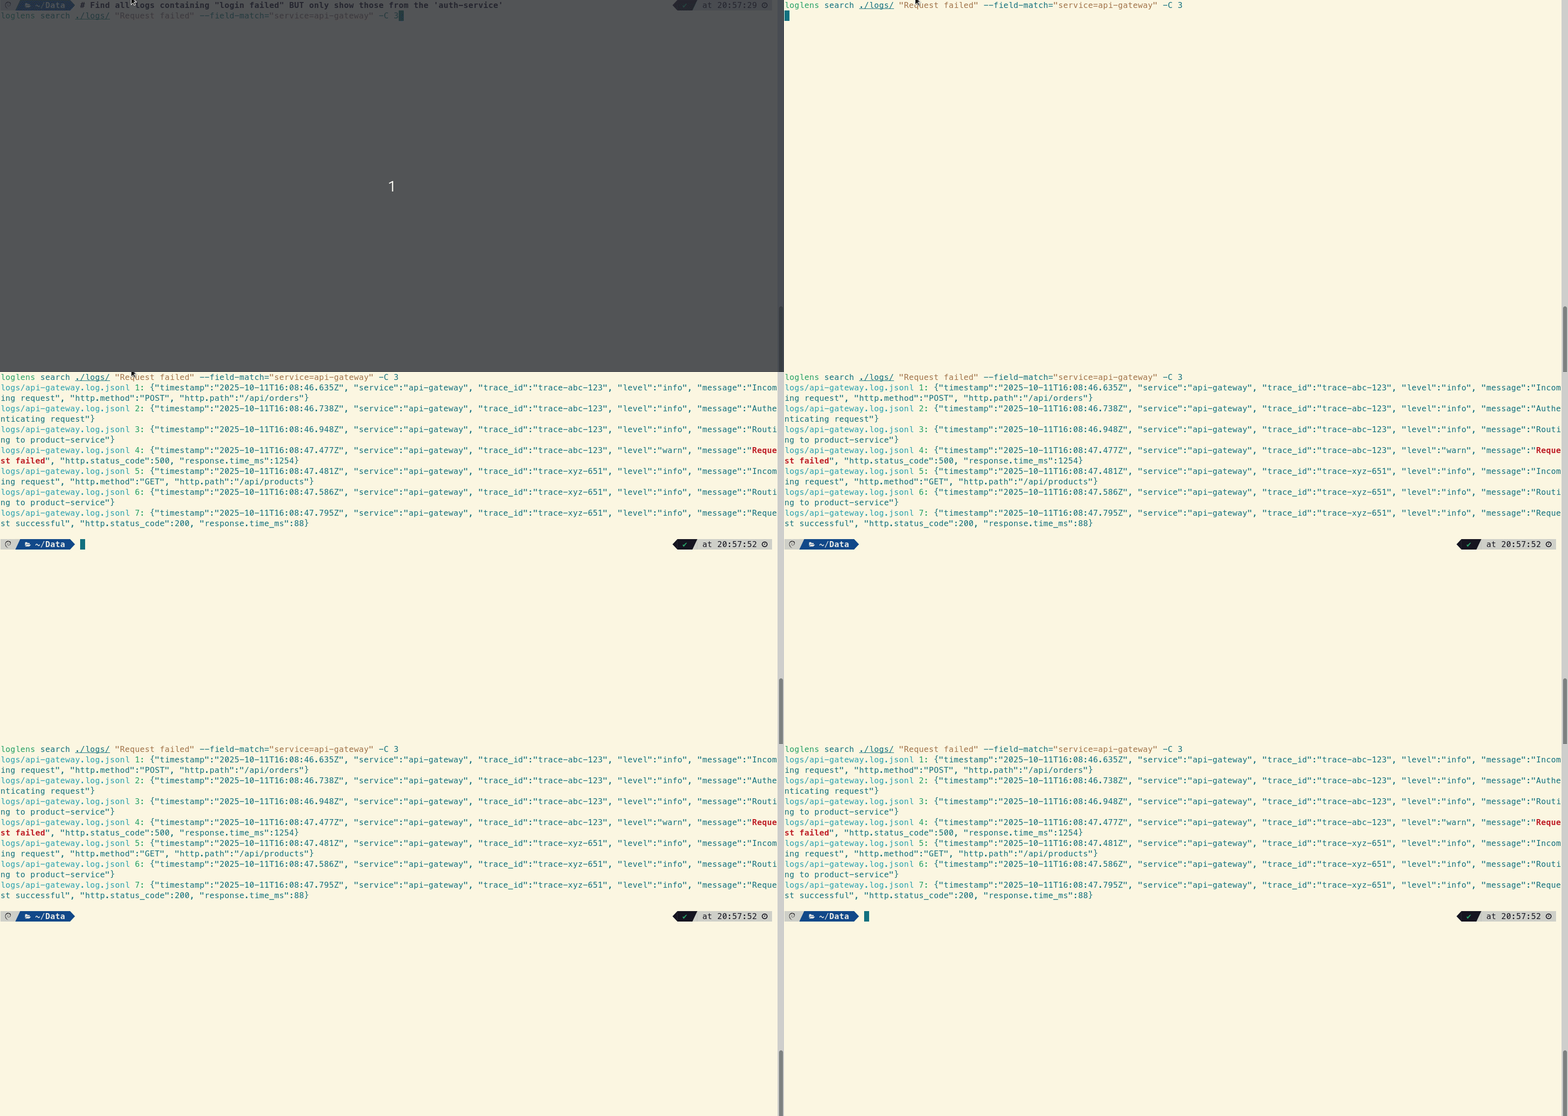
Finding an error message is only the first step. The real challenge is understanding the context that led to it. Stop manually hunting through logs. Use the context flag (-C
) to instantly see the events before and after any error, revealing the root cause in seconds.
# Find every failed request from the api-gateway and show 3 lines of context
loglens search ./logs/ "Request failed" --field-match="service=api-gateway" -C 3
Debug Complex Microservices
Follow a single request's trace_id
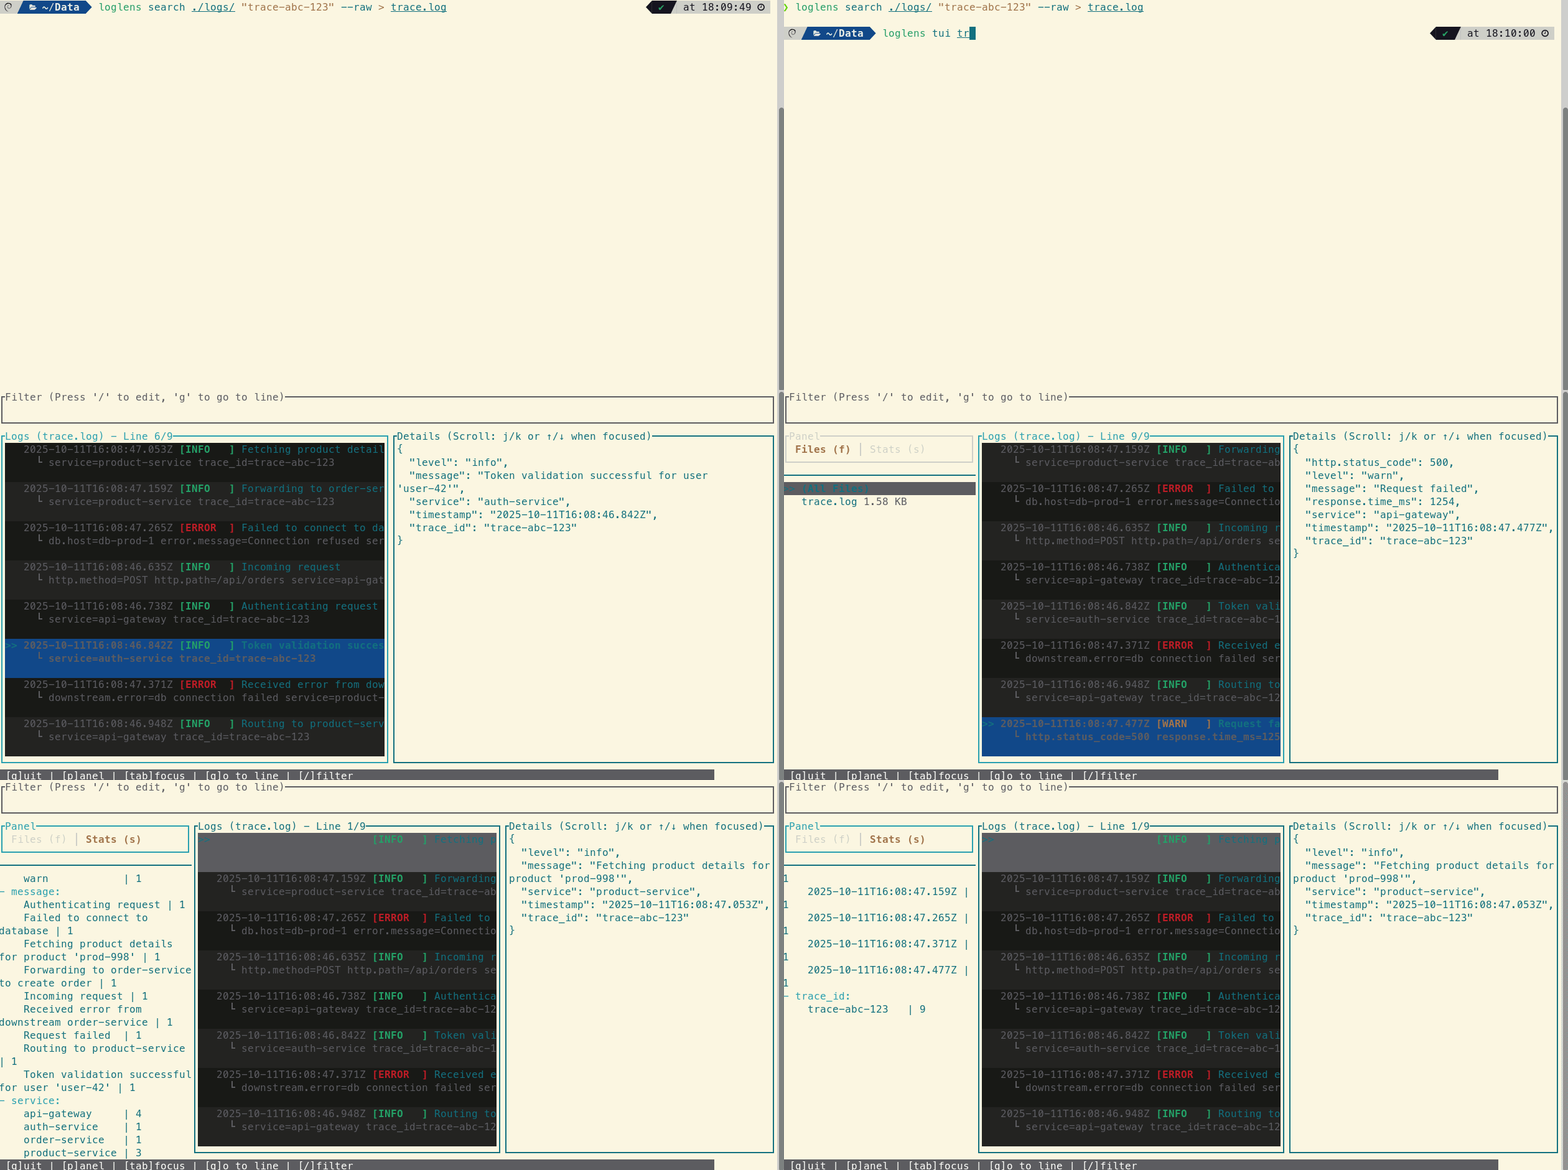
across a dozen distributed services. Reconstruct the entire event lifecycle to find the true source of failure, even with mixed or unstructured log formats. Stop guessing where a request failed and see its complete story.
# Collate all logs for a specific trace into one file, then analyze interactively
loglens search ./logs/ "trace-abc-123" --raw > trace.log && loglens tui trace.log
Monitor Live Systems & Deployments
Stop drowning in the firehose of tail -f
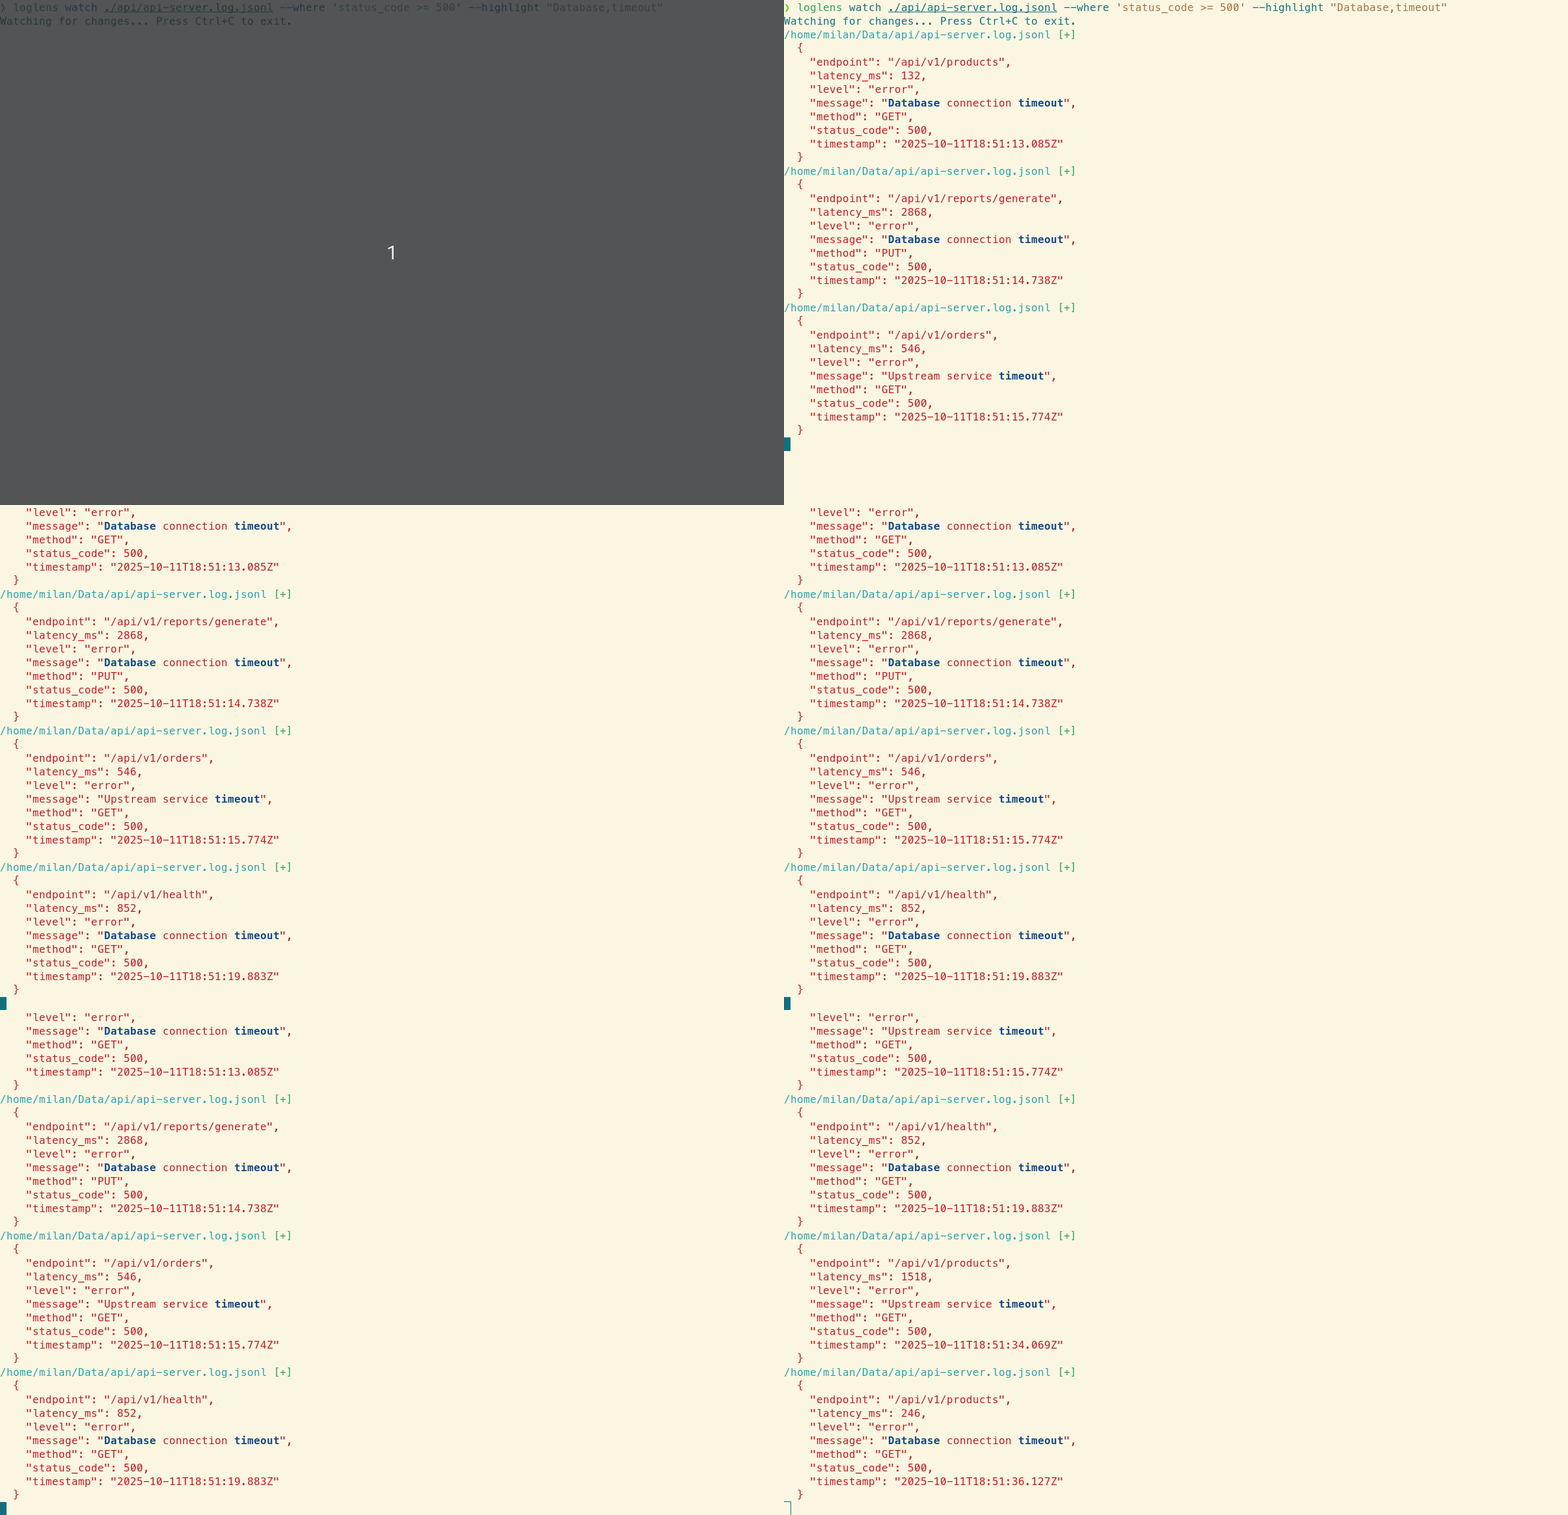
. During a deployment or incident, you need signal, not noise. LogLens's watch command tails your logs in real-time with powerful server-side filtering. See only the critical errors you care about, and highlight keywords to spot problems the second they happen.
# Tail API logs, but only show 5xx errors and highlight root cause keywords
loglens watch ./api/api-server.log.jsonl --where 'status_code >= 500' --highlight "Database,timeout"
Slash Your Cloud Logging Bill
Stop overpaying for hot log storage. Archive your logs to cheap cloud storage like Amazon S3 and analyze them locally with LogLens. It handles massive, compressed .gz
files on the fly, giving you the power of an expensive SaaS platform for a fraction of the cost.
# Directly open and analyze a multi-gigabyte compressed log archive. No unzipping required.
loglens tui ./archives/prod-api-2025-10-28.log.gz
Deep-Dive Performance Analysis
Is your API slow? Stop guessing and start measuring. First, get a bird's-eye view of all endpoint latencies to spot the bottleneck. Then, run a deep-dive statistical analysis on just the problematic endpoint to understand its true performance profile, including min, max, and average response times.
# 1. First, find the average latency for each endpoint to identify the slowest one.
loglens stats legacy ./api/ --count-by "endpoint" --avg "latency_ms"
# 2. Then, run a full statistical analysis on just the slow endpoint.
loglens stats describe ./api/ latency_ms --where 'endpoint == "/api/v1/reports/generate"'
Pinpoint Slow Endpoints During an Outage
Is your API slow during an incident? Stop guessing which endpoints are failing. Use the powerful group-by
command combined with a --where
filter to instantly generate a performance report for only the failing requests. Pinpoint exactly which endpoint has the highest latency under error conditions and focus your debugging efforts where they matter most.
#Instantly see which failing endpoints have the highest latency
loglens stats group-by ./api/ --by "endpoint" --avg "latency_ms" --where "status_code >= 500"
Ready to Solve Your Toughest Problems?
Get started for free or unlock the full power of LogLens with a Pro license.
Install LogLens Get Pro License